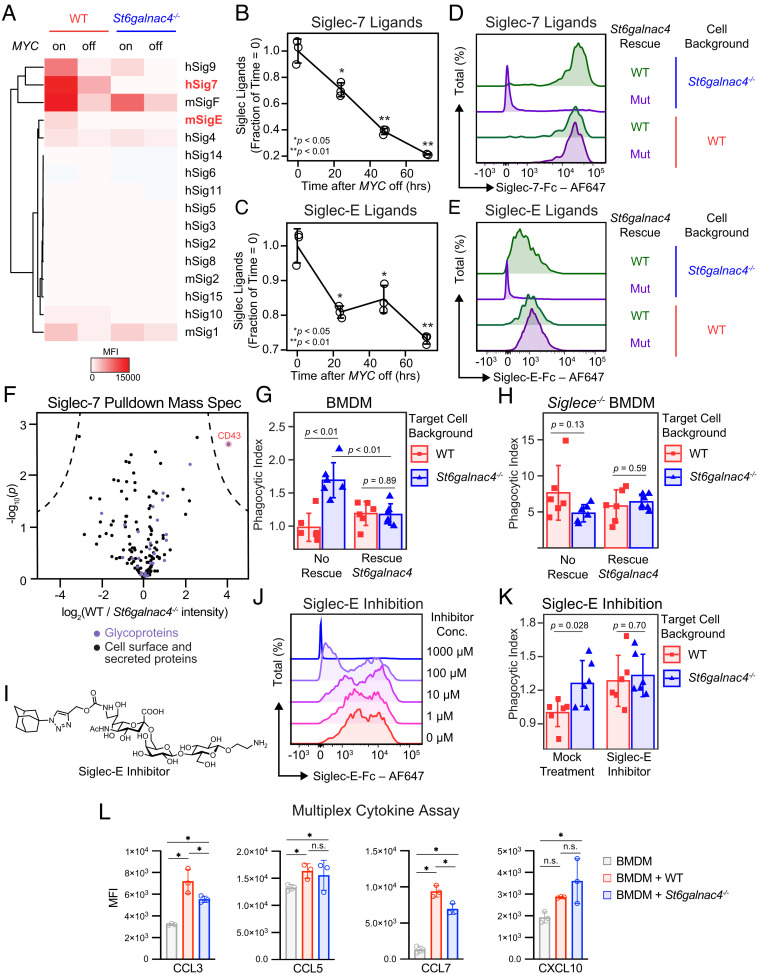
Fig. 2.
ST6GALNAC4 synthesizes Siglec-E/-7 ligands. (A) Heatmap of Siglec binding capacity displayed by control or St6galnac4−/− T-ALL as measured by flow cytometry following staining with the indicated Siglec-Fc reagent. Cells were treated with either PBS or doxycycline for 48 h to turn off the MYC transgene. Siglec-Fc reagents are indicated on the right side of the plot, where “m” indicates murine and “h” indicates human. Bold/red font highlights substantial reductions in the presentation of ligands for human Siglec-7 and murine Siglec-E on St6galnac4−/− and MYC off cells. Plot is representative of two independent experiments. (B and C) Display of ligands for Siglec-7 (B) and Siglec-E (C) on murine T-ALL at the indicated time points after turning MYC off as quantified by flow cytometry following staining with a Siglec-Fc reagent (n = 3 per time point, two-tailed Student’s t test comparing each time point to t = 0 h. *P < 0.05, **P < 0.01, data are representative of two independent experiments). Data are normalized to control, mean ± SD. (D and E) Representative flow cytometry plots of Siglec-7 (D) and Siglec-E (E) ligands displayed by WT and St6galnac4−/− cells reexpressing wild type (WT) or mutant (Mut) St6galnac4. Plots are representative of three independent experiments. (F) Proteins enriched by immunoprecipitation of T-ALL lysate with Siglec-7-Fc were identified by shotgun proteomics. Annotated cell surface or secreted proteins are displayed on the plot in black, with purple denoting the subset of glycoproteins. The intensity of spectra from WT relative to St6galnac4−/− T-ALL is displayed [n = 3 per group, significance cutoff by Student’s t test with a false discovery rate of 0.0001 and minimum enrichment (S0) of 5]. (G) Phagocytosis by BMDMs of WT and St6galnac4−/− T-ALL rescued by transfection with empty vector or St6galnac4 (n = 6 per group, two-tailed Student’s t test). Data are normalized to control (WT, no rescue) and presented as mean ± SD. (H) Phagocytosis by Siglece−/− BMDMs of WT and St6galnac4−/− T-ALL rescued by transfection with empty vector or St6galnac4 (n = 6 per group, two-tailed Student’s t test). Data are normalized to control (WT target cells, WT BMDMs, no rescue) and presented as mean ± SD. (I) Structure of the Siglec-E inhibitor. (J) Inhibition of Siglec-E-Fc binding to murine T-ALL by the Siglec-E inhibitor. Plot representative of three independent experiments. (K) Phagocytosis by BMDMs of control and St6galnac4−/− T-ALL in the presence of Siglec-E inhibitor or mock DMSO treatment (n = 6 per group, two-tailed Student’s t test). Data are normalized to control (mock-treated WT target cells) and presented as mean ± SD. (L) Cytokines released by BMDMs after incubation with anti-Thy1.1 antibody plus WT or St6galnac4−/− target cells (n = 3 per group, two-way ANOVA using a single family and Tukey’s test for multiple comparisons, * is significant with adjusted P < 0.0001). Full multiplex cytokine panel in supplement.

