Fig. 3.
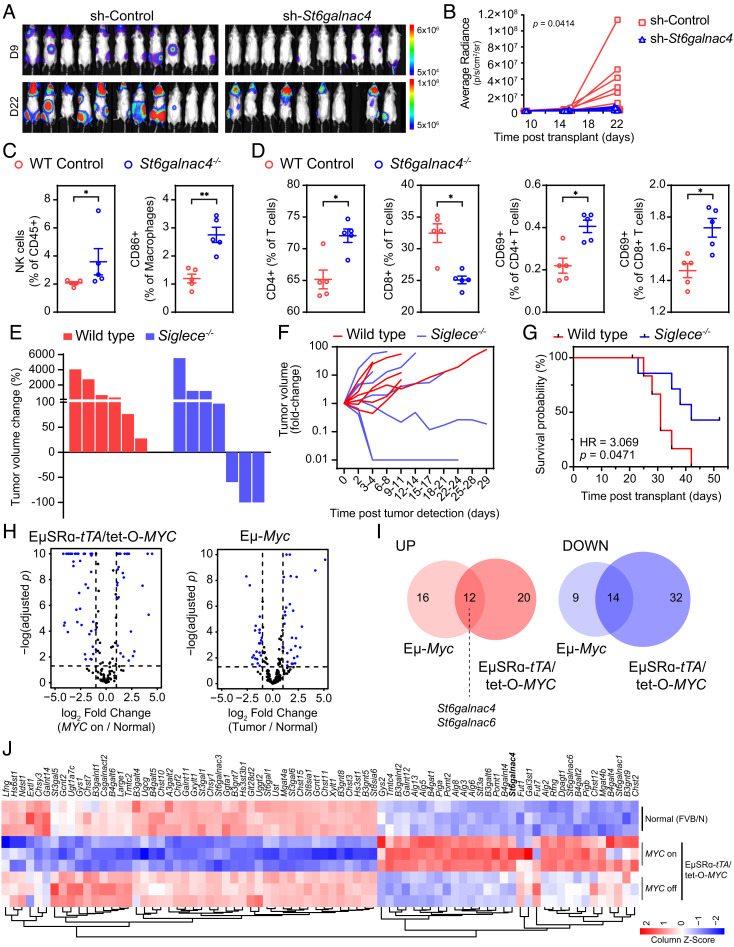
St6galnac4 promotes tumor growth in vivo. (A) Bioluminescence imaging of syngeneic WT FVB/N mice transplanted IV with luciferase-labeled MYC-driven T-ALL cells expressing either a St6galnac4-specific or control shRNA. Images show tumor burden on day 9 and 22 posttransplantation. (B) Tumor growth in mice described in (A) was assessed by bioluminescence imaging over time and quantified [n(sh-Control) = 11, n(sh-St6galnac4−/−) = 9, mixed effects analysis]. (C and D) Flow cytometric analysis of splenocytes (C) and peripheral blood mononuclear cells (D) isolated from FVB/N mice 23 d after IV-transplantation of MYC-driven T-ALL expressing either wild type (WT) St6galnac4 (WT Control, n = 5) or lacking St6galnac4 expression (St6galnac4−/−, n = 5). Frequencies of indicated immune cell subsets are shown per mouse (two-tailed Mann–Whitney test, *P < 0.05, **P < 0.01). (E and F) MYC-driven T-ALL was transplanted subcutaneously into either WT or Siglece−/− mice. Tumor growth was monitored by caliper measurement. (G) Survival of T-ALL bearing WT and Siglece−/− mice after undergoing subcutaneous T-ALL transplantation. HR, hazard ratio from the Mantel-Cox test. (H) Volcano plots displaying glycogenes in MYC-driven mouse models of Burkitt lymphoma (Eμ-Myc) and T-ALL (EμSRα-tTA/tet-O-MYC). (I) Overlap analysis of differentially expressed glycogenes (at least twofold change with FDR < 0.05) from (H) (glycogenes up and down: OR = 4.91, P = 9.04 × 10⁻⁷) in mouse models of Burkitt lymphoma (Eμ-Myc) and T-ALL (EμSRα-tTA/tet-O-MYC). (J) Heat map representation of glycogenes that are differentially expressed in splenocytes isolated from EμSRα-tTA/tet-O-MYC (MYC on/off) and normal (FVB/N) mice. Expression in normal tissue, in MYC on tumor tissue, and upon MYC inactivation-induced tumor regression (MYC off) is shown (n = 3 per treatment group).

