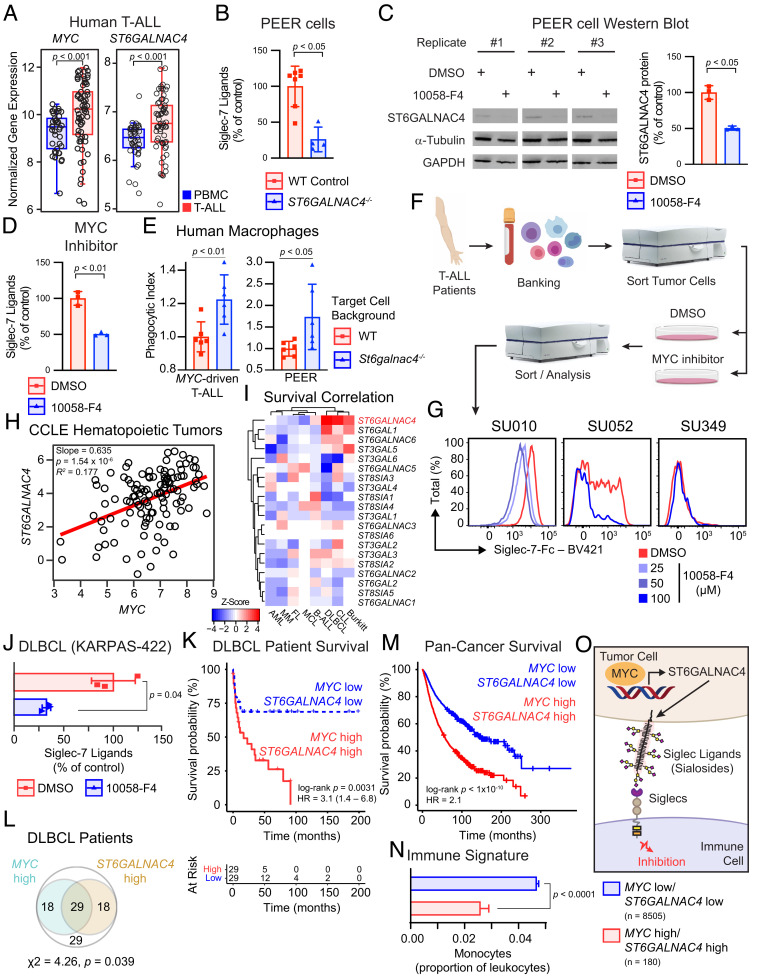
Fig. 4.
MYC promotes Siglec-7 ligand display on human cancer. (A) Summarized gene expression of MYC and ST6GALNAC4 in human T-ALL and peripheral blood mononuclear cells (PBMCs). Data from GSE62156, GSE27562, and GSE49515 were collated, and absolute expression was determined with Gene Expression Commons [n(tumor) = 65, n(control) = 45, two-tailed Mann–Whitney U test]. Boxplot shows data quartiles. (B) Siglec-7 ligands on PEER cells following knockout of ST6GALNAC4 [n(control) = 7, n(KO) = 4, two-tailed Mann–Whitney U test]. Data presented as mean ± SD. (C) Representative Western blot for ST6GALNAC4 in PEER cells following MYC inhibition with 100 μM 10058-F4 for 48 h. Quantification of ST6GALNAC4 band intensity normalized to α-tubulin and WT control (n = 3 per group, two-tailed Student’s t test). Data presented as mean ± SD. (D) Siglec-7 ligands on PEER cells following pharmacologic MYC inhibition for 48 h by incubation with 100 μM 10058-F4 (n = 3 per group, two-tailed Student’s t test). Data presented as mean ± SD. (E) Phagocytosis of WT and St6galnac4−/− murine MYC-driven T-ALL and human PEER cells by human monocyte derived macrophages (n = 6 per group, two-tailed Student’s t test). Data are normalized to WT control and presented as mean ± SD. (F) Workflow to collect primary T-ALL from patients, treat with a MYC inhibitor (10058-F4), and quantify Siglec-7 ligands. (G) Siglec-7 ligands on patient T-ALL liquid biopsies treated with the indicated concentration of 10058-F4 for 48 h. Data represent three donors. (H) Correlation of ST6GALNAC4 and MYC mRNA (RNA-seq) gene expression across all hematopoietic tumor samples (n = 106) in the CCLE with MYC expression > 3. Correlation determined by least-squares regression. (I) Survival Z-score heatmap for each sialyltransferase across each hematopoietic tumor within the PRECOG database. Larger positive Z-Scores (red) indicate that patients with higher expression of the indicated gene exhibit reduced survival. AML, acute myeloid leukemia; MM, multiple myeloma; FL, follicular lymphoma; MCL, mantle cell lymphoma; B-ALL, B cell acute lymphoblastic leukemia; DLBCL, diffuse large B cell lymphoma; CLL, chronic lymphocytic leukemia. (J) Siglec-7 ligand display by KARPAS-422 DLBCL cells following treatment with 100 μM 10058-F4 for 48 h (n = 3 per group, two-tailed Student’s t test). Data presented as mean ± SD. (K) Survival stratified by median MYC and ST6GALNAC4 expression in a cohort of DLBCL patients (GSE4475). HR, hazard ratio from Cox Proportional Hazards model. (L) Venn diagram of patients in the same DLBCL cohort, showing individuals that fall into MYC high and ST6GALNAC4 high (greater than median expression) groups (χ2-test for independence). (M) Pan-cancer overall survival analysis of TCGA data stratifying patients by median MYC and ST6GALNAC4 expression (n = 2,376 per group). HR, hazard ratio from Cox Proportional Hazards model. (N) Pan-cancer immune phenotype of TCGA tumors stratified by k-means clustering based on MYC and ST6GALNAC4 expression. Monocyte prevalence was calculated as a fraction of all leukocytes. Data presented as mean ± SEM. (O) Model for MYC-driven display of disialyl-T and regulation of the immune response via Siglec engagement.

