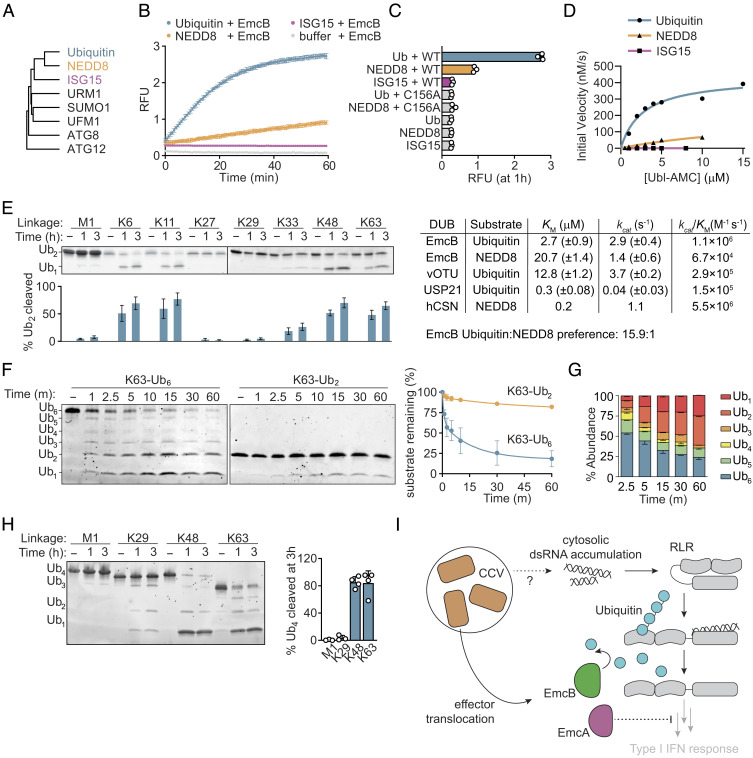
Fig. 4.
EmcB is a ubiquitin-specific protease that efficiently cleaves long ubiquitin chains. (A) Phylogenetic tree of ubiquitin-like modifiers. Tree was rooted on autophagy related gene 12 (ATG12). (B) Fluorometric cleavage assay of C-terminal ubiquitin-like AMC conjugates. Ub-AMC, NEDD8-AMC, and ISG15-AMC (400 nM) were incubated with 3.5 nM EmcB, and RFU was measured. Cleavage allows fluorescence of AMC. Data are mean ± SD of three technical replicates representative of two independent experiments. (C) Fluorometric cleavage assay of Ubiquitin and ubiquitin-like modifier-7-Amino-4-methylcoumarin (UBL-AMC) conjugates. RFU measurement at 1 h of incubation of indicated AMC conjugate with indicated protein. Data are mean ± SD representative of two independent experiments. P < 0.0001 for Ub vs. EmcB, Ub EmcB vs. Ub EmcB C156A, NEDD8 mock vs. NEDD8 EmcB; Ub vs. Ub EmcB C156A, NEDD8 mock vs. NEDD8 EmcB C156, ISG15 mock vs. ISG15 EmcB all n.s. by one-way ANOVA with Dunnett correction. (D) Kinetics of EmcB protease activity toward ubiquitin-like AMC conjugates; 150 nM EmcB was incubated with indicated concentration of indicated AMC conjugate, and initial velocity was determined. Comparison of activity to values of select deubiquitinases and deNEDDylase provided from refs. 57–59. (E) SDS-PAGE analysis of diubiquitin cleavage. Representative SYPRO Ruby stained SDS-PAGE of diubiquitin (3 μM) with EmcB (1 μM). Quantification of cleaved diubiquitin by densitometry below indicated lane are mean ± SD of three independent experiments. P value comparing cleavage for each chain at 0 h vs. indicated time, M1 1 h and 3 h n.s., K6 1 h and 3 h <0.0001, K11 and 3 h <0.0001, K27 1 h and 3 h n.s., K29 1 h and 3 h n.s., K33 1 h n.s., 3 h <0.05, K48 1 h and 3 h <0.0001, and K63 1 h and 3 h <0.0001 by one-way ANOVA with Dunnett post hoc test. (F) SDS-PAGE analysis of ubiquitin cleavage by chain length. Representative Sypro Ruby-stained gel of K63-linked ubiquitin (1 μM) of indicated length incubated with EmcB (0.25 μM). Quantification of cleavage of full-length hexaubiquitin (blue) or diubiquitin (green). Data are mean ± SEM of two independent experiments. P < 0.01 hexaubiquitin vs. diubiquitin at 2.5 min+ by one-way ANOVA with Šídák post hoc test. (G) Relative ubiquitin chain length abundance of hexaubiquitin from F. Data are mean ± SEM. (H) SDS-PAGE analysis of tetraubiquitin cleavage. Representative Sypro Ruby-stained SDS-PAGE of tetraubiquitin (1 μM) cleavage by EmcB (0.25 μM). Representative of ≥3 independent experiments. Quantification of cleavage at 3 h, bars are mean ± SD. (I) Model depicting how translocation of EmcA and EmcB by C. burnetti residing in host cells can inhibit RLR signaling at different stages which prevents type I IFN production.

