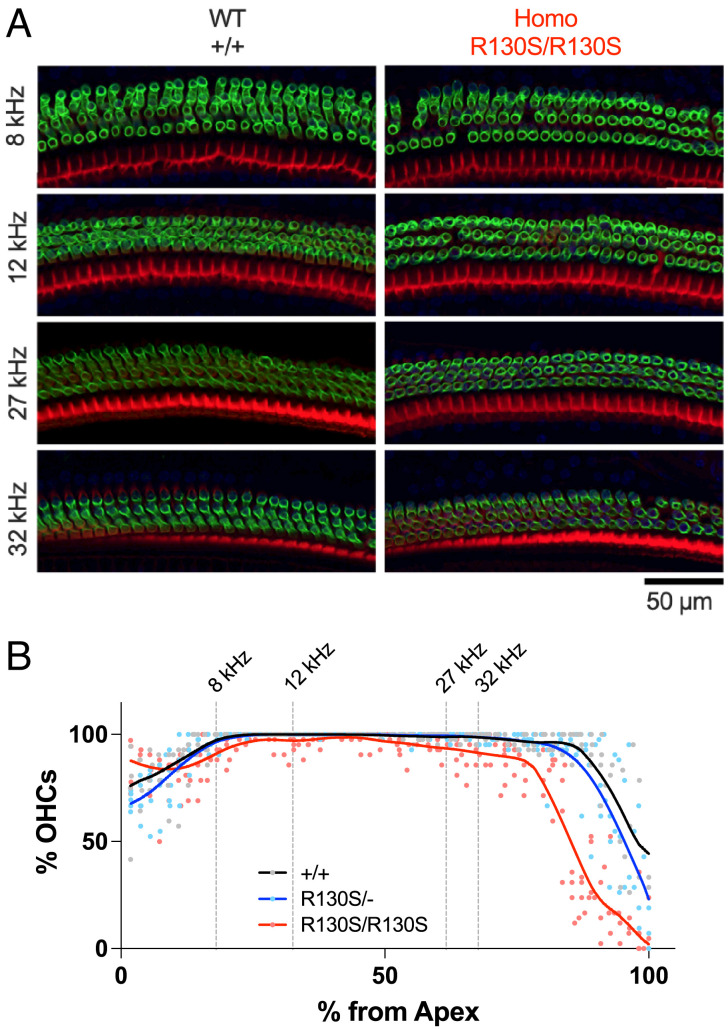
Fig. 2.
OHC cytocochleograms of R130S-prestin KI mice. (A) Fluorescent images of P42 organ of Corti whole-mount samples from Slc26a5+/+ and Slc26a5R130S/R130S mice, stained with anti-prestin antibody (green) and phalloidin-Alexa568 (red). (B) Cytocochleograms for Slc26a5+/+ (n = 4), Slc26a5R130S/+ (n = 5), and Slc26a5R130S/R130S (n = 5) (P42 for all). Solid lines indicate Locally Weighted Scatterplot Smoothing (LOWESS) fits. Cochlear locations corresponding to the frequencies tested for the ABR and DPOAE measurements (Fig. 1) are indicated by vertical broken lines.

