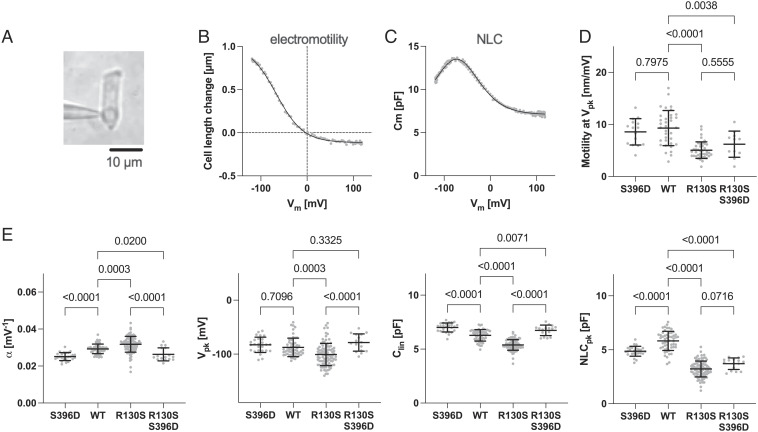
Fig. 5.
Electromotility and NLC recordings in OHCs. (A) Whole-cell recording configuration established in an isolated OHC (WT). Examples of electromotility (B) and NLC (C) measurements (WT). Solid lines indicate two-state Boltzmann curve fits. Summaries of electromotility (D) and NLC parameters (E) recorded in OHCs isolated from R130S-prestin, S396D-prestin, and R130S/S396D-prestin homozygous mice and WT controls. NLCpk, the magnitude of NLC at Vpk. The P values were computed by one-way ANOVA followed by Tukey’s multiple comparison procedure. Horizontal solid lines indicate the means and SDs. OHCs were collected from the apical region (corresponding to 4 to 10 kHz) of the cochlea and obtained from mice between P30 and 53.

