Fig. 5.
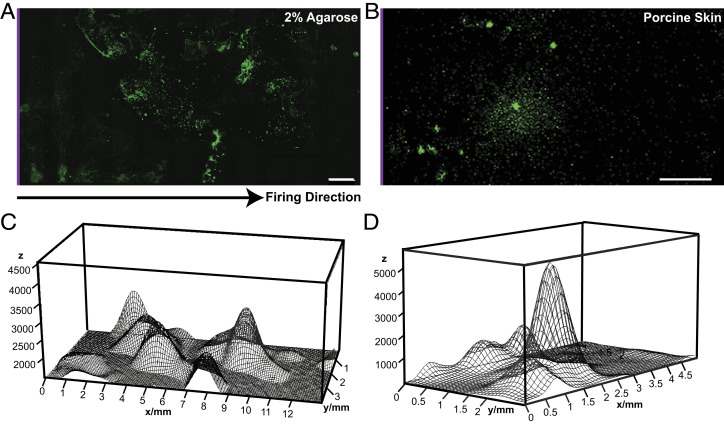
(A and B) Maximum intensity projection of the confocal Z-stack image of Cy5@Neu@Z-32 delivered biolistically into agarose tissue model and porcine skin tissue. Cy5@Neu@Z-32 was first delivered into a 2% agarose gel tissue model at 2,068 kPa with a nozzle-to-gel distance of 2 cm, and into porcine skin tissue at 4,826 kPa with a nozzle-to-tissue distance of 0.5 cm. The sample was then flipped onto a clean surface to avoid dragging the particles deeper into the gel, and cross-sectioned using a sharp blade. The cross-sectioned specimen was placed on a #0 coverslip with the top surface (depth = 0 mm, marked with a purple line) on the reader’s left, and confocal micrographs were captured. (Scale bar, 1 mm.) (C and D) three-dimensional population density plot representing the distribution of Cy5@Neu@Z-32 within the gel and tissue calculated from the overlay image shown in Fig. 3 A and B, respectively. The plots were generated using Fiji (image processing and analysis software).

