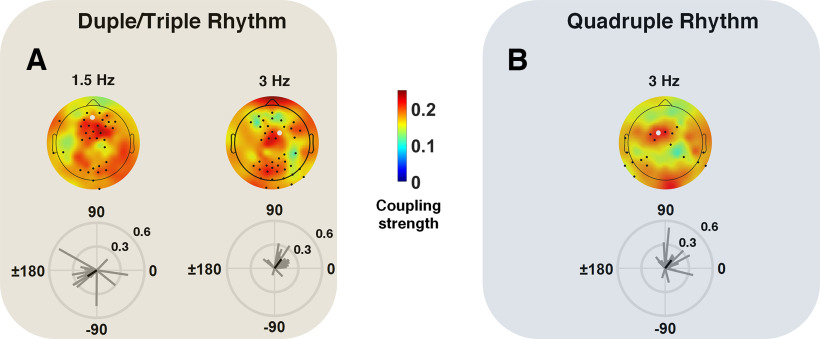
Figure 4.
A, B, The topographical maps of averaged coupling strength between neural activity and rhythmic patterns are shown for Duple/Triple Rhythm (A) and Quadruple Rhythm (B). The electrodes for which circular nonuniformity of phase values was confirmed using the Rayleigh test (p < 0.05) are indicated by black dots. The individual coupling phase and strength are shown for sample electrodes (white dots) below the topographical maps. The black vector illustrates the circular group average.

