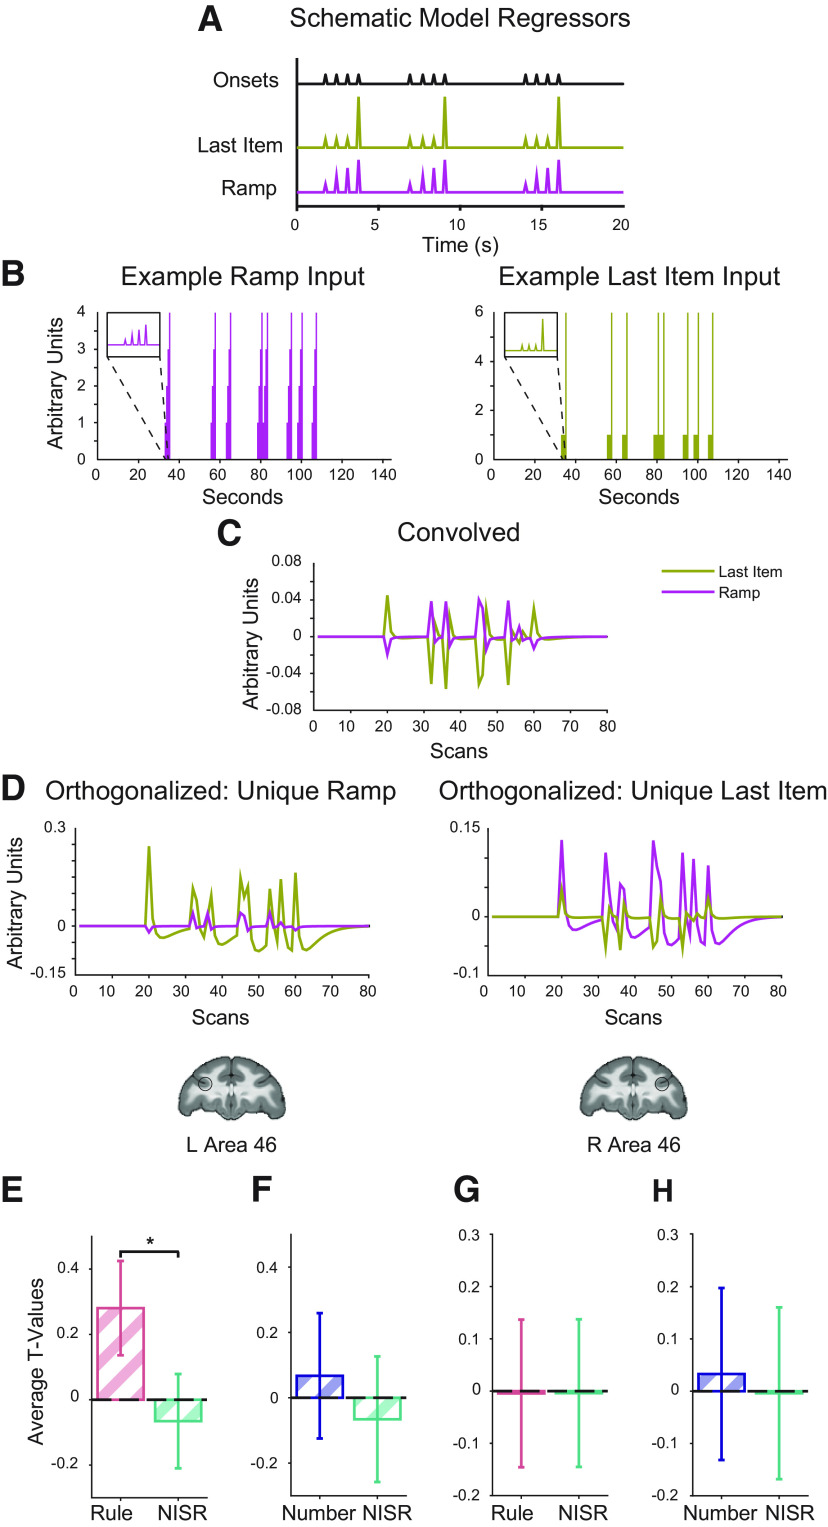
Figure 4.
Area 46 shows ramping activity for deviations to an established sequence rule. Parametric models and t values for the condition of interest > baseline shown. Coronal brain slices (y = 33) show locations of area 46 ROIs, L46 and R46, outlined in black. A, Schematic of regressors used to model parametric ramp and parametric last item. B–D, Example actual Ramp and Last Item regressors through the orthogonalization process. Note that SPM first creates regressors from onsets (in seconds, shown in B) in samples using higher resolution to be convolved (C), and then they are down-sampled before being orthogonalized (D) and entered in the GLM. E, Unique ramping during rule deviants compared with NISR in L46 showed a reliable difference (*p < 0.05 for sequence type, see Table 4). F, Unique ramping during number deviants compared with NISR in L46. G, Unique ramp number deviants compared with NISR in R46. H, Unique ramping during number deviants compared with NISR in R46. Comparisons that were not reliably different showed similar trends. Error bars are 95% confidence intervals (1.96 × SE of the within-bin mean).

