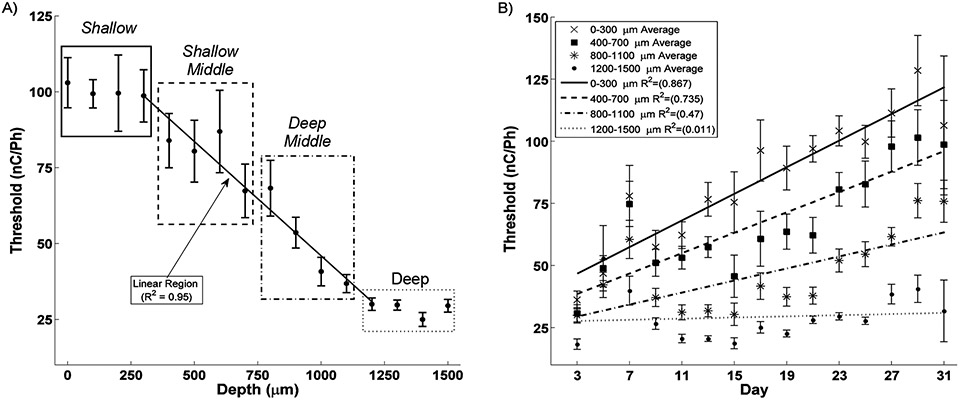
Figure 1. Effect of Depth and Time.
A) Detection threshold show a clear relationship with depth. The four Shallow sites (0-300 μm, solid box) have the highest thresholds while the Deep sites (1100-1500 μm, dotted box) have the lowest thresholds. The eight middle cites in negatively correlate with depth (R2 = 0.95). Clustering these eight sites into Shallow Middle and Deep Middle demonstrates the roll of depth on threshold stability B). Shallow, Shallow Middle, and Deep Middle sites significantly increase while Deep sites show no change in threshold during the first month after implantation.

