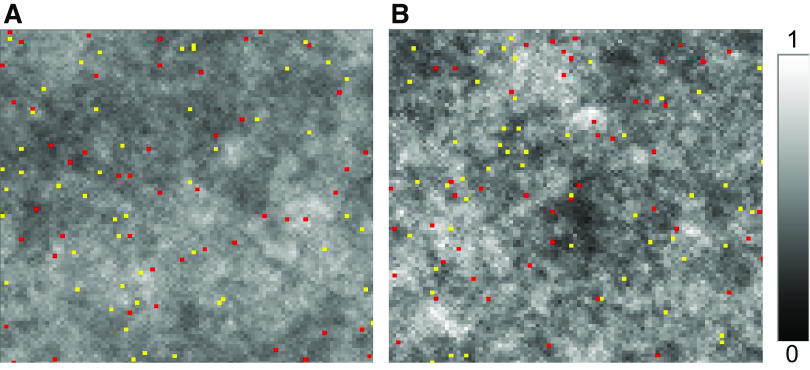
Figure 1.
Tissue density maps obtained via agent-based model of tissue maintenance. Catabolic cells (red) digest a fixed fraction α of the tissue on each patch at each time step, whereas anabolic cells (yellow) lay down a fixed amount αβ of tissue on each patch, where β = 0.5 (the units of α and β are arbitrary). A: α = 0.01, the mean tissue density is 0.503, and the SD of the tissue density on each patch is 0.082. B: α = 0.02, the mean tissue density is 0.507, and the SD of the tissue density on each patch is 0.117. White corresponds to a tissue density of 1, whereas black corresponds to a tissue density of 0. The positions of the anabolic and catabolic cells shown correspond to the end of the simulation in each case.

