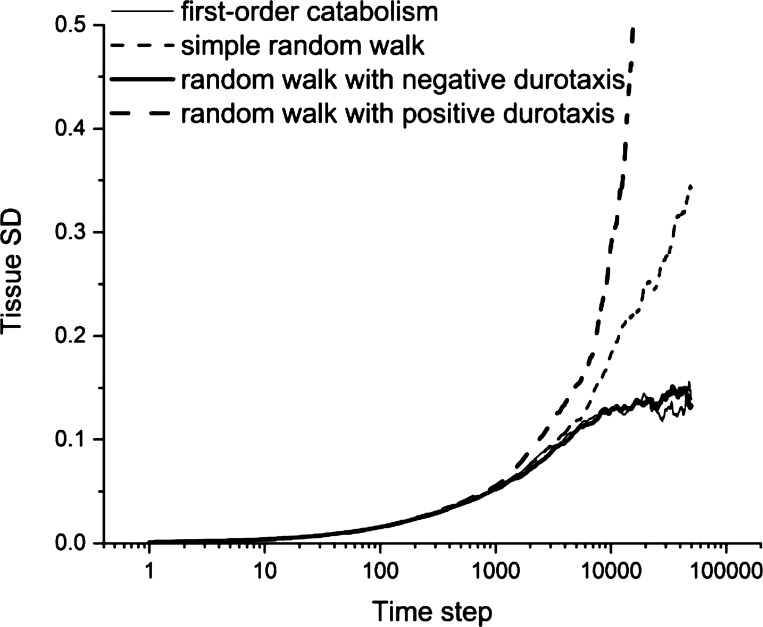
Figure 9.
Evolution of tissue heterogeneity. The model was run for 50,000 time steps with 150 agents of each type and α = 0.02. Heterogeneity levels off after about 5,000 steps with both first-order catabolism (thin solid line) and the random walk modified by negative durotaxis (thick solid line), on contrast to the increase with the square root of the number of steps seen in heterogeneity with the simple random walk (thin dashed line) and the random walk modified by positive durotaxis (thick solid line).

