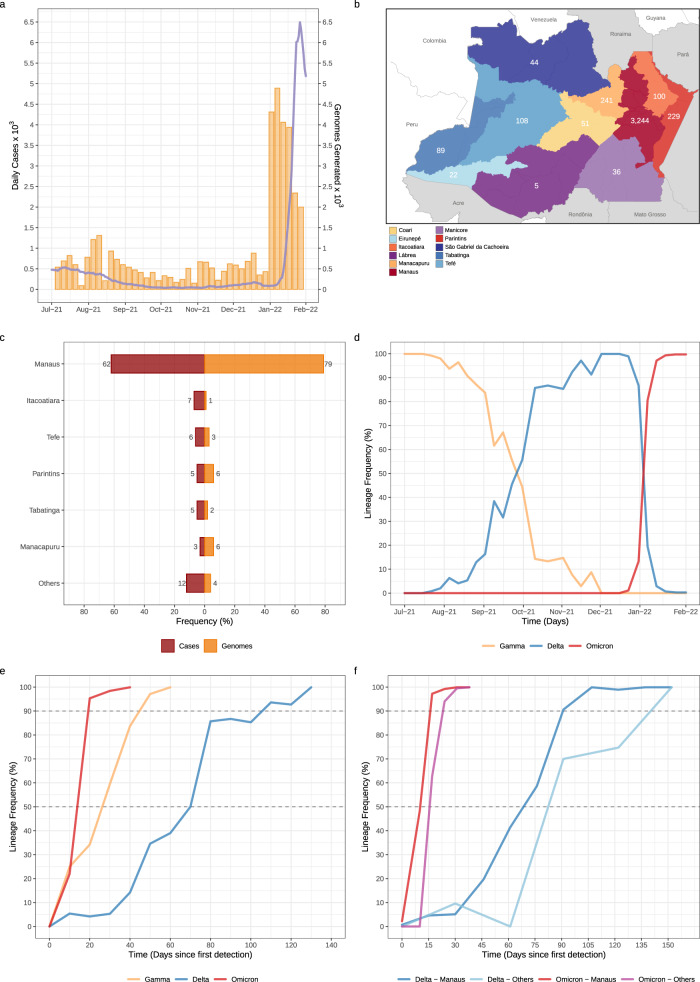
Fig. 1. Temporal and geographic distribution of SARS-CoV-2 cases and genomes in Amazonas state.
a Rolling average (7-day) of daily new SARS-CoV-2 confirmed cases in Amazonas (solid line) and the number of SARS-CoV-2 genomes sequenced in this study (yellow bars) between 1st July 2021 and 31st January 2022. b Map of Amazonas state showing regions covered by the SARS-CoV-2 genomes generated in this study. Numbers represent genomes generated for each region. c Number of SARS-CoV-2 confirmed cases and SARS-CoV-2 genomes from different Amazonian regions between 1st July 2021 and 31st January 2022. d–e Frequency of VOCs Gamma, Delta, and Omicron BA.1 among SARS-CoV-2 positive samples sequenced in Amazonas since 1st July 2021 (d) or since the first detection of each viral variant (e). f Frequency of VOCs Delta and Omicron BA.1 among SARS-CoV-2 positive samples sequenced within and outside Manaus since the first detection of each viral variant. Amazonas’ map was generated with QGIS v.3.10.2 software (http://qgis.org) using public access data downloaded from the GADM v.3.6 database (https://gadm.org) and shapefiles obtained from the Brazilian Institute of Geography and Statistics (https://portaldemapas.ibge.gov.br/portal.php#homepage).

