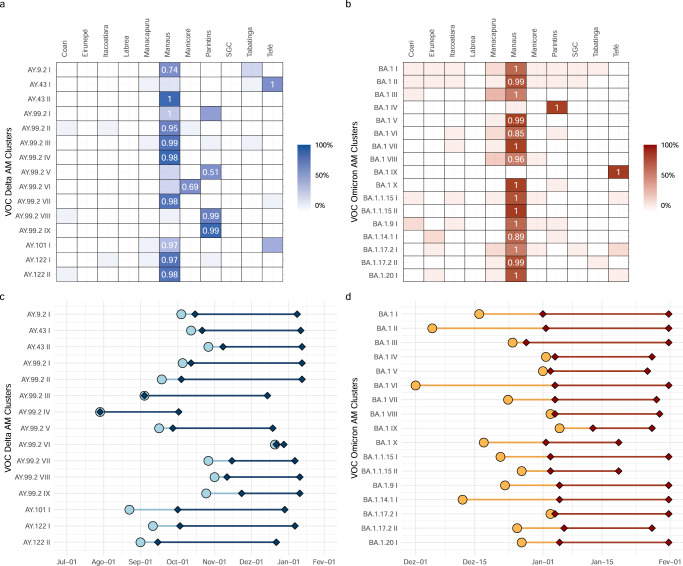
Fig. 6. Identification of major Delta and Omicron BA.1 transmission lineages in Amazonas state.
a, b Heatmap cells are colored according to the proportion of Delta and Omicron sequences from different state regions within each major Amazonian transmission lineage. Numbers indicate the posterior state probability (PSP) of the most probable source location. c, d Timeline of major Amazonian Delta and Omicron genomic clusters. Median TMRCA (circles) and dates of first and last sampling times (diamonds) are plotted on the X axis and genomic cluster on the Y axis. Light color lines correspond to detection lag (i.e., the difference between the TMRCA and the date at which a transmission lineage was detected) and dark color lines correspond to the full sampling range of each transmission cluster.

