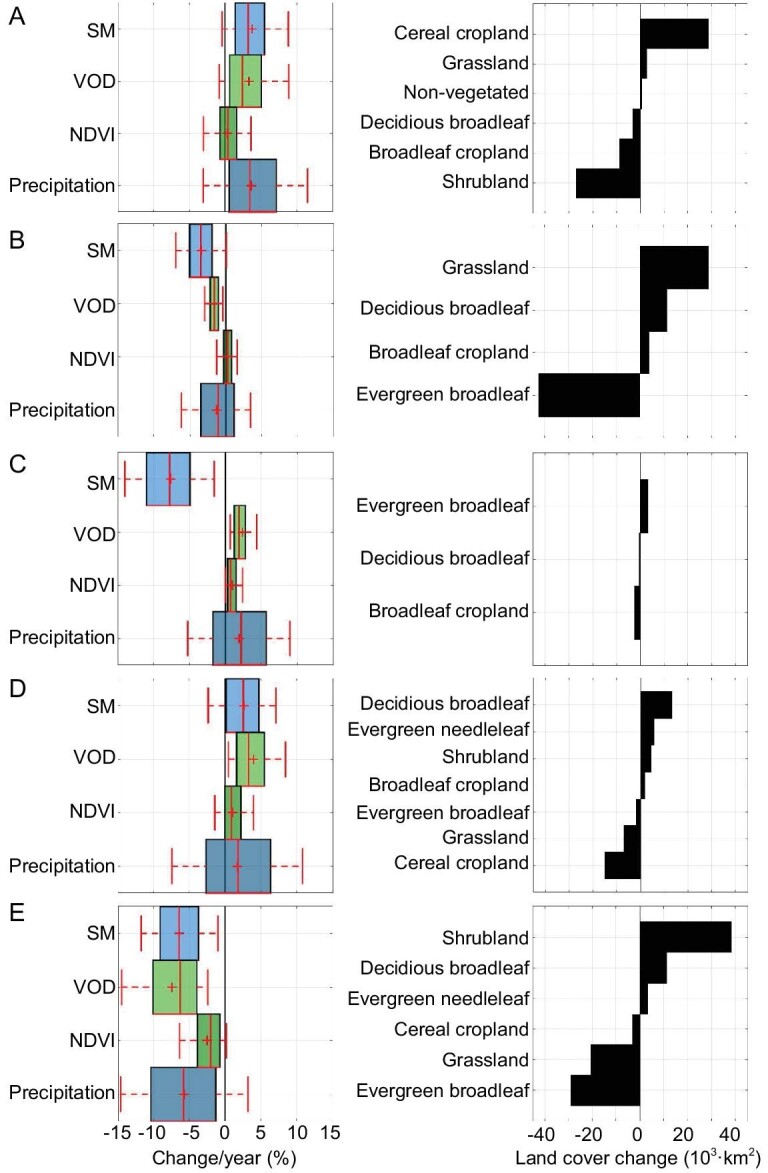
Figure 2.

Boxplots of annual trends (in percentages) of SM, VOD, NDVI and accumulated precipitation (left column) and land cover change (right column) for the period 2010–20 for clusters A to E (cf. Fig. 1 and Table 1). Land cover changes and trends unmask the major changes in the identified clusters. Cluster A is related to natural reforestation and shows increasing trends in SM and precipitation followed by an increase in VOD. This reflects increased water supply and plant growth, mainly related to cereal croplands. Cluster B is related to deforestation and rainfall change and reflects a decreasing trend in all four variables. It appears more pronounced in SM and VOD, and the degradation of forested areas transitioning to grasslands. Cluster C, related to artificial reforestation, shows an increase in VOD and a notable decrease in SM, probably related to the increasing water demand of new forested areas. The fact that the NDVI changes are less pronounced can be due to the saturation effect of optical indices in high biomass regions, which does not affect VOD in the L-band. Cluster D, related to rain shift or irrigation changes, shows a notable increase in VOD, followed by SM and precipitation, which correspond to two major land-use changes depending on the region: either expansion of broadleaf croplands (e.g. northern India peninsula) or encroachment of grassland becoming forest (e.g. Central North America). Cluster E, related to wildfires and land clearance, shows a notable decrease in all four variables and conversion of forest and grasslands into shrublands.
