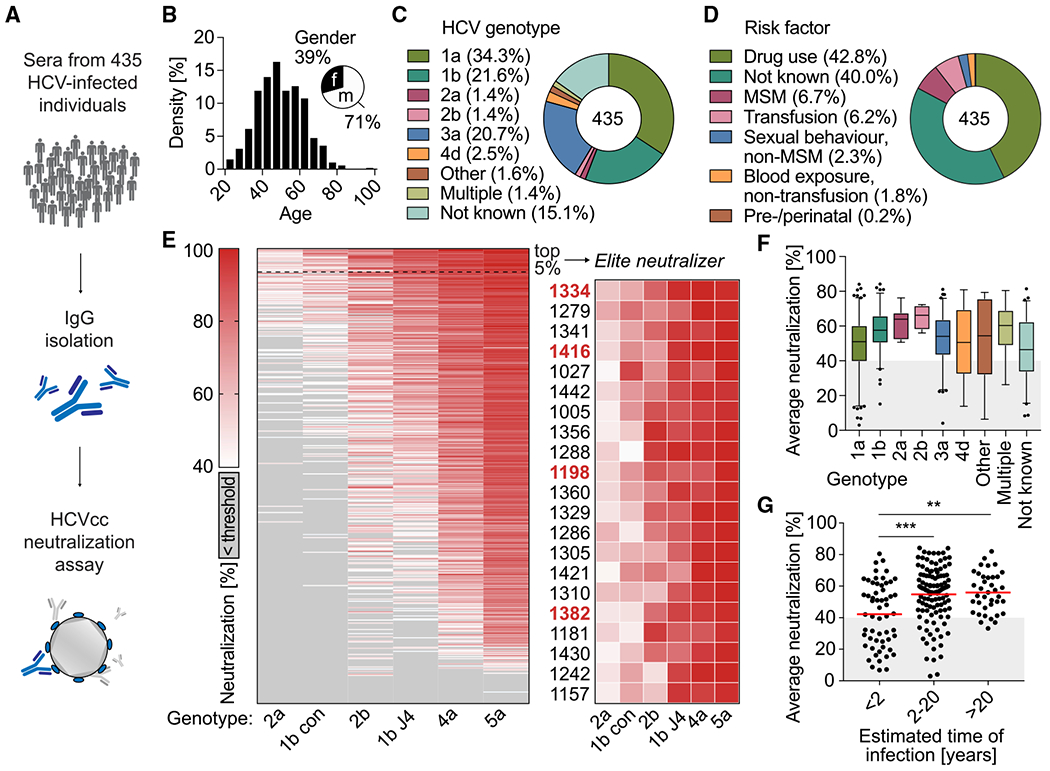
Figure 1. HCVcc screening identified 5% of HCV-infected individuals with outstanding “neutralizing activity”.

(A) pIgG from 435 HCV-infected individuals was screened for neutralizing activity in an HCVcc assay.
(B) Age and gender distribution of HCV-infected individuals.
(C) HCV genotypes that individuals were infected with.
(D) Self-reported most likely risk factor for HCV infection.
(E) Left panel: screening of pIgG for neutralizing activity against authentic HCV virions. Huh 7.5 cells were infected with 6 different HCVcc strains (columns) carrying a Renilla luciferase reporter gene, in the presence of 300 μg/mL pIgG from HCV-infected individuals (rows). HCV neutralization was determined by reduction of luciferase activity in Huh 7.5 cells relative to cells infected with virus alone. Sorted by row means (average neutralization). Medians of triplicate measurements. Screening was performed once. Right panel: enlarged heatmap showing IDs of individuals with average neutralization in the top 5% range and neutralization of all HCVcc strains. Red IDs: individuals who later donated peripheral blood mononuclear cells.
(F) Influence of the HCV genotype on average neutralization of pIgG samples. Lines, boxes, and whiskers indicate medians, 25%–75%, and 5%–95% percentiles, respectively.
(G) Influence of estimated time of HCV infection on average neutralization. Data are plotted for 209 individuals. No data on time of infection were available for 226 individuals. Lines indicate means.**p ≤ 0.01, ***p ≤ 0.001; two-tailed Mann-Whitney test with Bonferroni correction. See also Figure S1.
