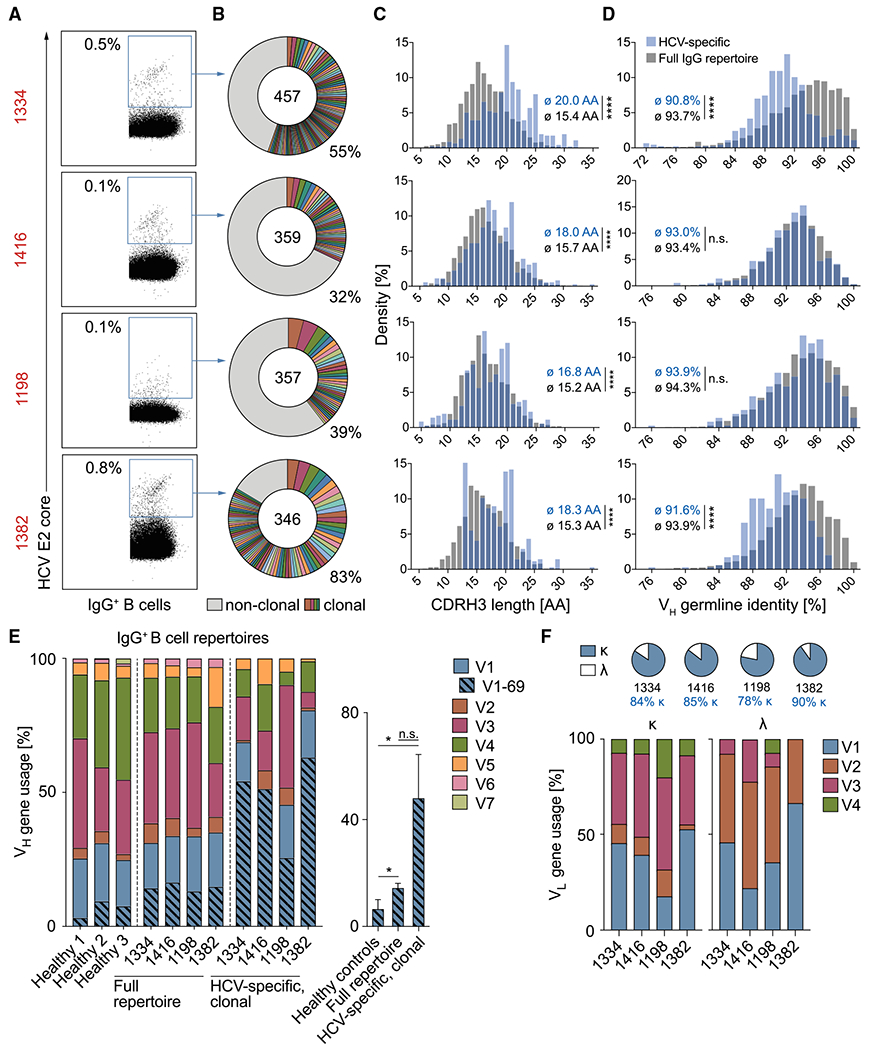
Figure 2. HCV elite neutralizer B cell repertoires are polyclonal and VH1-69 biased.

(A) Exemplary dot plots of IgG+ B cell analysis (see also Figure S2A). Numbers in red are IDs of HCV-infected individuals (see also Table S1). Numbers in plots indicate percent frequencies of E2 core-reactive B cells within IgG+ B cells (see also Table S2). Sorting was performed once.
(B) Clonal relationship of E2 core-reactive B cells. Clones are shown in different colors. Numbers of productive heavy-chain sequences are depicted in the chart center. Clone sizes are proportional to the total number of productive heavy-chains per clone.
(C–E) Frequencies of CDR3 length (C), V gene germline identity (D), as well as V gene segments (E) of productive heavy-chain sequences obtained from E2 core-reactive B cells compared with NGS reference data from full IgG+ B cell repertoires of the same individuals. Reference data from three randomly selected healthy donors in (E) are also included in a previous publication (Kreer et al., 2020b). Right panel of (E): quantification of VH1-69 heavy-chain frequencies. Means ± SDs are plotted. Not significant (n.s.), p > 0.05, *p ≤ 0.05, **p ≤ 0.01, ****p ≤ 0.0001; two-tailed Mann-Whitney test with Bonferroni correction (C and D) or two-tailed t test with Bonferroni correction (E).
(F) Characteristics of amplified light chains.
