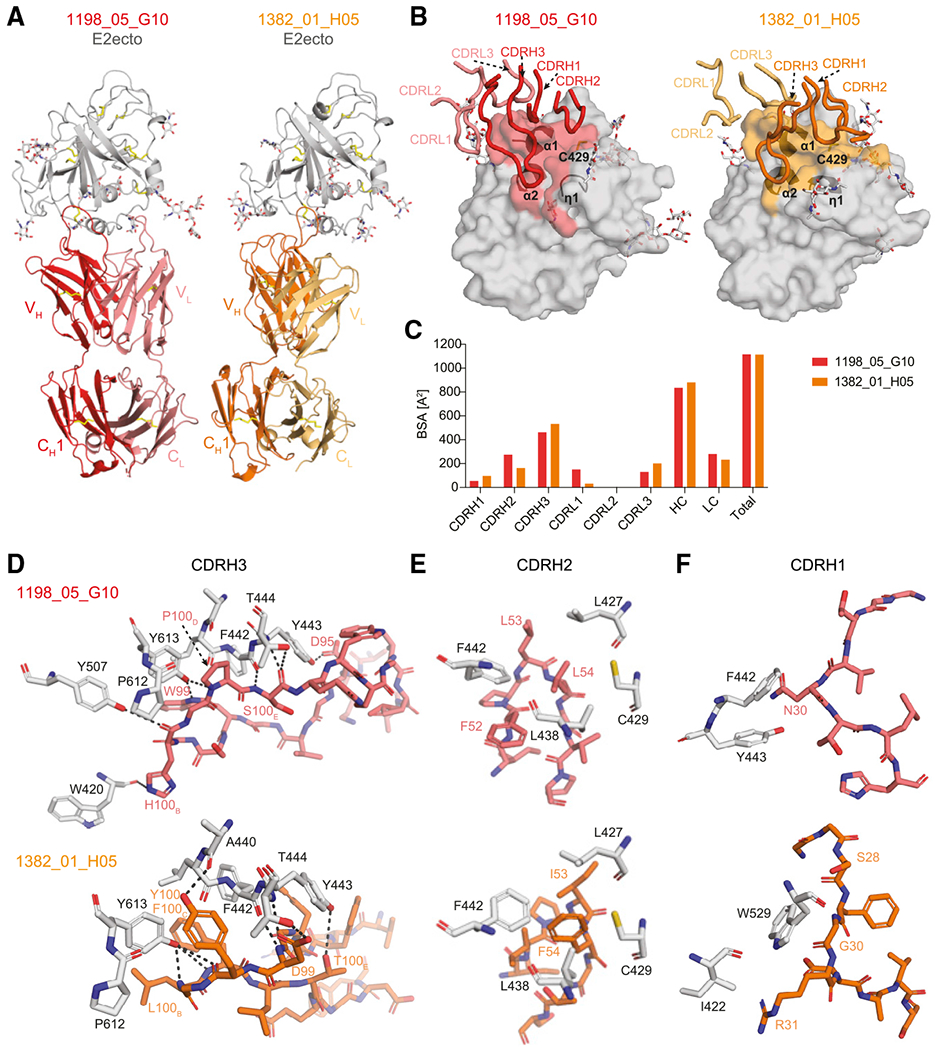
Figure 4. Crystal structures of 1198_05_G10-E2ecto and 1382_01_H05-E2ecto complexes reveal a distinct binding mode of human HCV bNAbs.

(A) Crystal structures of the 1198_05_G10-E2ecto and 1382_01_H05-E2ecto complexes. E2ecto is shown as a cartoon representation with N-glycans highlighted as sticks and disulfide bonds shown as yellow sticks. Fabs are shown as cartoons with 1198_05_G10-HC colored in red; 1198_05_G10-LC—light red, 1382_01_H05-HC—orange, and 1382_01_H05-LC—yellow. The structures were superimposed on E2 proteins.
(B) Comparison of 1198_05_G10 and 1382_01_H05 CDR loop positions and corresponding E2 epitopes. Epitopes on the E2 front-layer surface were defined as residues in E2 containing an atom within 4 Å of the bound Fab. The positions of three α1-helices and Cys429 residue are indicated.
(C) Comparison of buried surface areas (BSAs).
(D) Interactions of CDRH3 loops with E2ecto. Potential hydrogen bonds are shown as black dashed lines and residues at the interface are indicated. Hydrogen bonds for the 3.2 Å 1382_01 _H05-E2ecto structure should be considered tentative.
(E) Interactions of Fab CDRH2 loops with E2ecto. Residues at the interface are indicated.
(F) Interactions of Fab CDRH1 loops with E2ecto. Residues at the interface are indicated.
