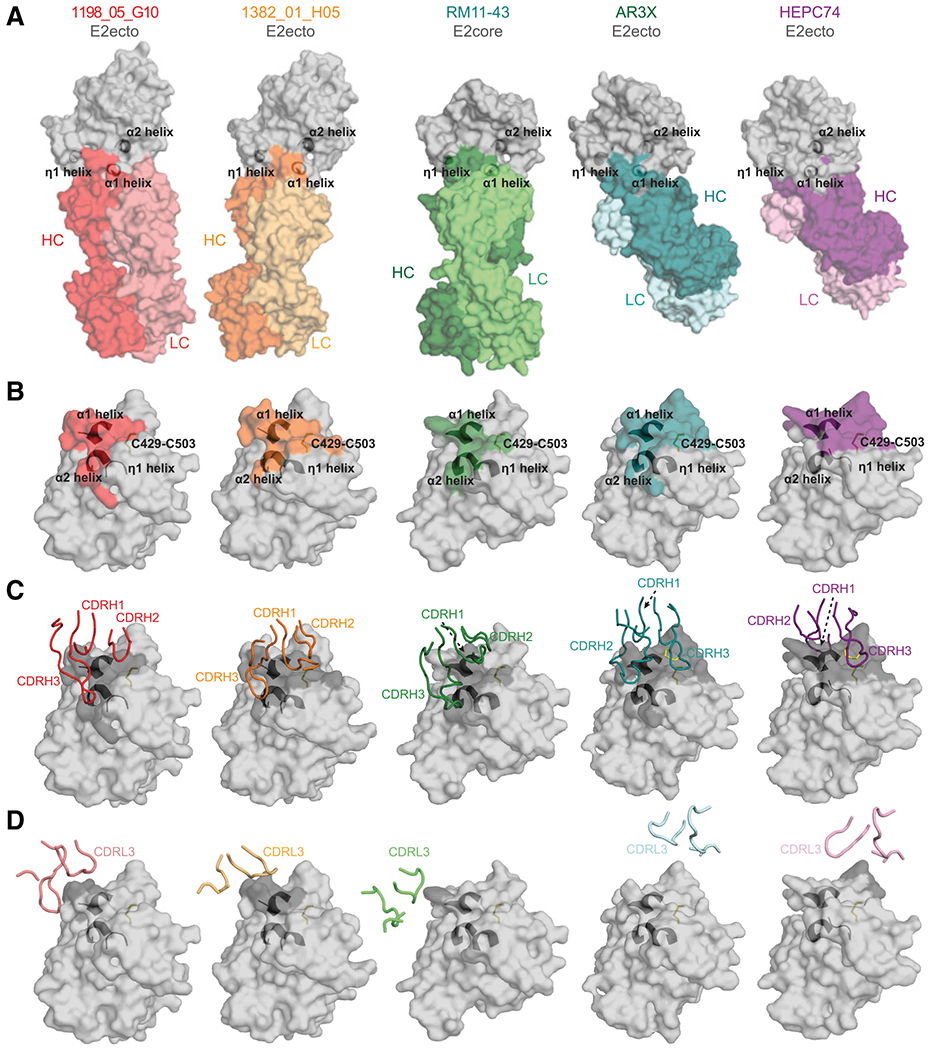
Figure 5. 1198_05_G10 and 1382_01_H05 share a similar binding mode with vaccine-induced bNAbs.

(A) Surface representations of 1198_05_G10-E2, 1382_01_H05-E2, and other bNAb-E2 crystal structures. The location of α1-, α2-, and η1-helices in E2 are indicated by black cartoon representations. The structures were superimposed on E2 proteins.
(B) Comparison of 1198_05_G10, 1382_01_H05, RM11-43, AR3X, and HEPC74 epitopes. Epitopes on the E2 front layer (surface representation) were defined as residues in E2 containing an atom within 4 Å of the bound Fab. The location of α1-, α2-, and η1-helices in E2 are indicated by black cartoon representations and the C429–C503 disulfide bond is indicated by yellow sticks.
(C) CDRH loops mapped onto the E2 surface. HC interacting residues are colored in gray on the E2 surface.
(D) CDRL loops mapped onto the E2 surface. LC interacting residues are colored in gray on the E2 surface.
