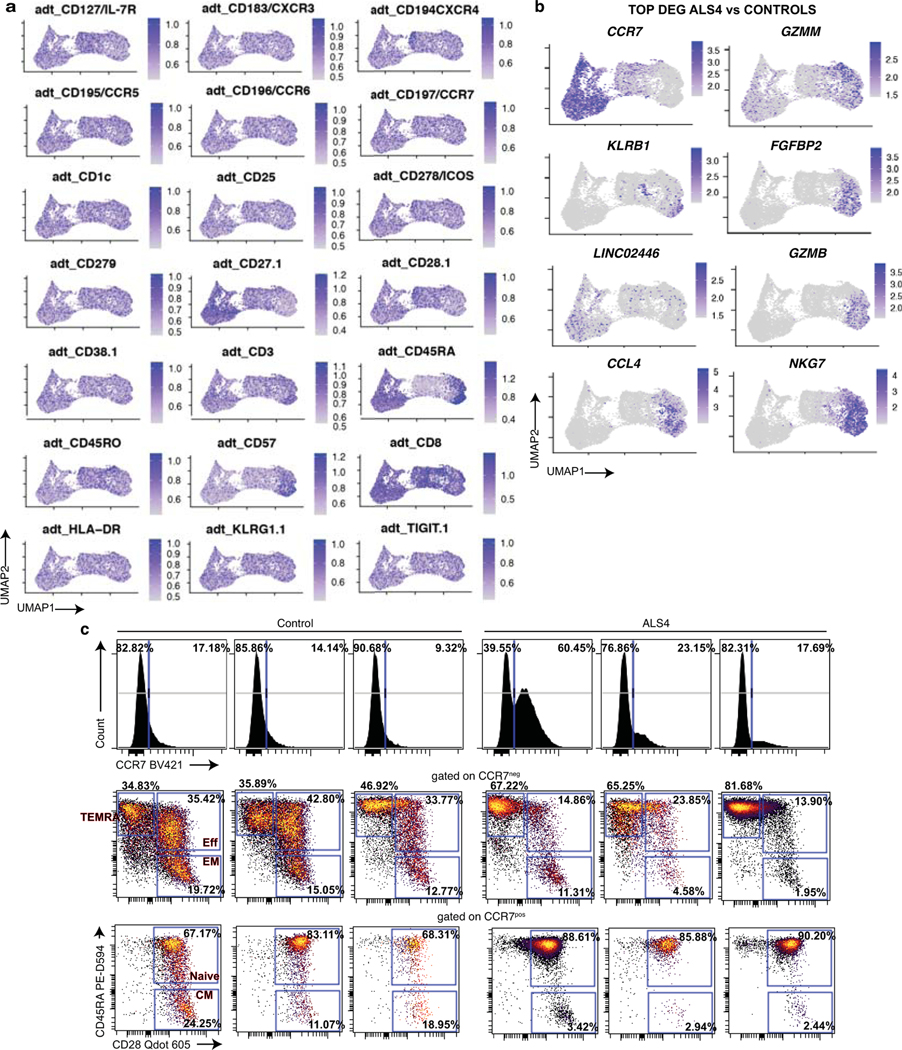
Extended Data Fig. 10. Phenotype of CD8 T cells from ALS4 patients and controls.
a,b, UMAP projections of identified clusters showing differential expression of surface markers (by oligo-conjugated antibodies) (a) and of the top genes (b) in ALS4 versus control donors. c, Spectral flow cytometry analysis of the 6 samples used for CITE-seq. Histograms show the frequency of CCR7+ CD8 T cells and dot plots the proportion of the indicated subsets after gating on CCR7pos or neg CD8 T cells as indicated.

