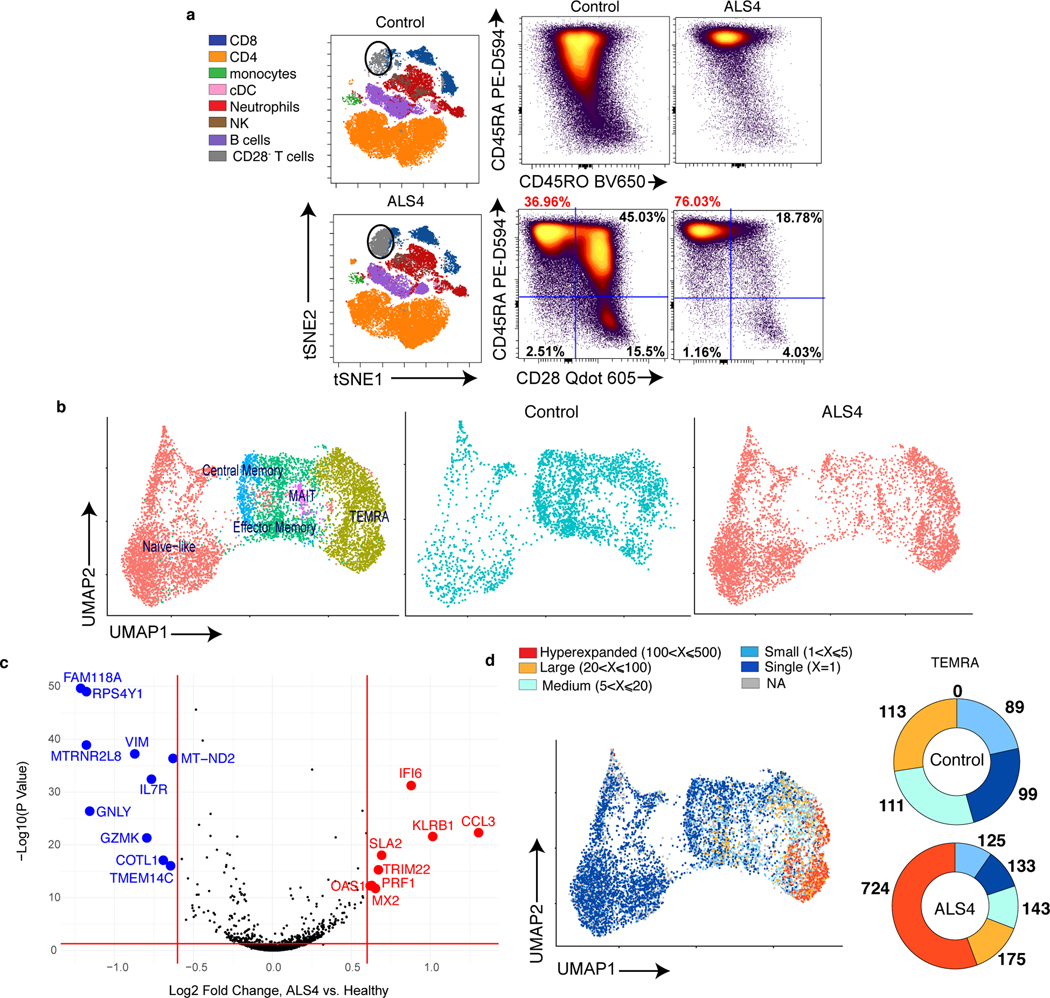
Fig. 4. Clonally expanded CD8 T cells with a TEMRA phenotype are increased in the peripheral blood of ALS4 patients.
a, Total PBMCs from ALS4 patients and age-matched controls were analyzed by spectral flow cytometry. Left, tSNE plots of FlowSOM metaclusters. The circular gates highlight a metacluster corresponding to a subset of CD8 T cells. Right, Dot plots displaying the frequency of CD45RA and CD45RO expression among CD8 T cells and of CD45RA and CD28 expression after gating on CCR7− CD8 T cells. Data shows concatenated data from 1 out of 2 independent experiments, n=5 (ALS4 patients) and n=10 (healthy controls). b-d, CD8 T cells purified from PBMCs of 3 ALS4 patients and 3 age-matched controls were analyzed by CITE-seq. b, Gene-expression analysis was conducted on all 6 samples and clustered by UMAP. Left, Identification of CD8 T cell subsets using a mixture of all groups is shown. Middle and right, Overlay of CD8 T cells from control or ALS4 patients on cellular subsets clustered by UMAP. c, Differential expression analysis of TEMRA CD8 T cells from ALS patients and healthy controls. d, Single-cell TCR analysis overlaid on UMAP projections of identified clusters showing TCRαβ clonality for each CD8 T cell subset (left) and donut plots depicting the number of TEMRA CD8 T cells expressing the same TCRαβ sequence (right).

