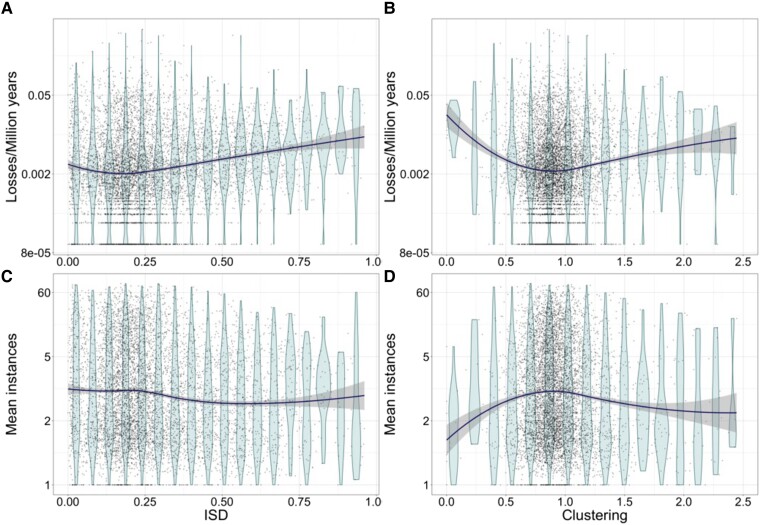
Fig. 2.
Pfam loss rates and copy number depend, often non-monotonically, on ISD and clustering values. The lowest loss rates are seen for Pfams with a mean ISD of 0.18 (A) and mean clustering value of 0.85 (B). Pfams with a low ISD have a higher number of instances per genome, in a more monotonic relationship (C). Pfams with a mean clustering value of 0.85 have the highest number of instances per genome. Each point represents a Pfam. Violin plots are a visual guide only, based on dividing the data into groups of equal range of ISD (A, C) or clustering (B, D). Loess regression curves are shown in dark, with 95% CIs shown as shading. In (A) and (B), horizontal bands of points near the bottom represent 0, 1, 2, etc. observed loss events, while in (C) and (D) horizontal bands represent Pfams present in only a single copy per genome. In (B) and (D), for better visualization, the x-axis has been truncated at 2.5.

