Fig. 3.
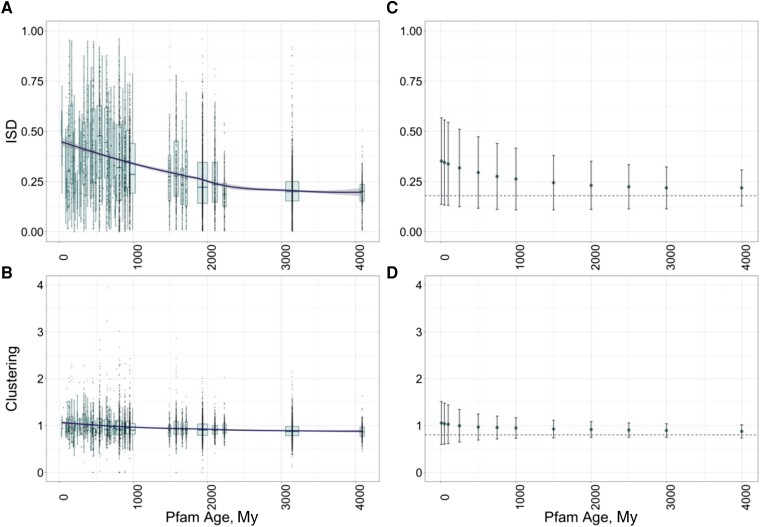
Observed phylostratigraphy trends in ISD (A) and Clustering (B) values occur on similar timescales as in our simulations of differential loss rates (C and D). In (A) and (B), each box represents all Pfams of a particular age category, with the widths of the boxes proportional to the square root of the number of Pfams in the group. Boxplots show the median, upper, and lower quartiles of the data, while the whiskers represent the largest and smallest data value above and below the interquartile range multiplied by 1.5. Grey points show the values for individual Pfams. The dark line is the loess regression slope of the effect of age on ISD (A) and clustering (B), with the 95% CI shown as shading. In (C) and (D), we plot the mean of ISD (C) and clustering (D), with error bars showing the standard deviation. Timepoints all use the same simulations and so are not independent, that is, the number of domains in our simulations decreases with time. Dashed lines indicate the values of ISD and clustering corresponding to the lowest loss rates. Loss rates for the simulations are those inferred from piecewise linear regression from figure 2A and B.

