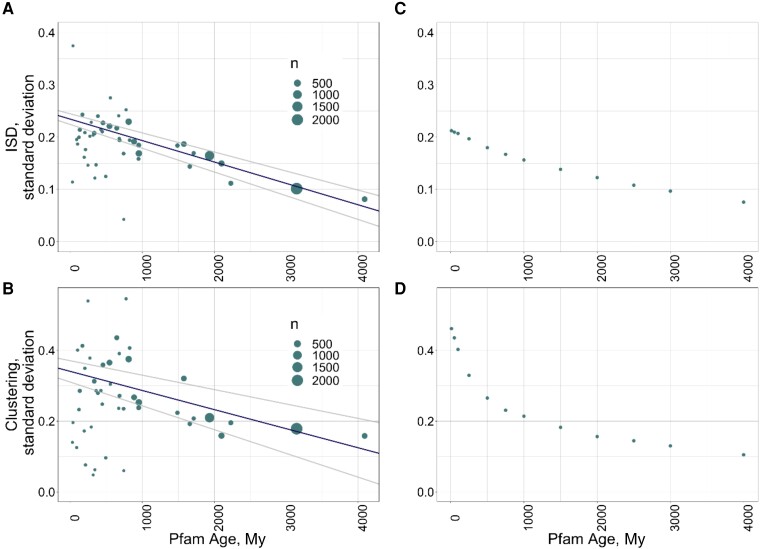
Fig. 4.
Younger Pfam cohorts have higher variance within their ISD (A) and clustering (B) distributions, a trend whose timescale is captured in our simulations (C, D). (A) and (B) Point size is scaled by n = number of Pfams in that category. Lines show the weighted linear regressions (weighted by number of observations per category), and their 95% CIs. In (A), for ISD, weighted R2 = 0.60, P = 2e−10. In (B), for clustering, weighted R2 = 0.60, P = 2e−10. In (C) and (D), the standard deviation of ISD (C) and clustering (D) values are plotted for cohorts of simulated Pfams.

