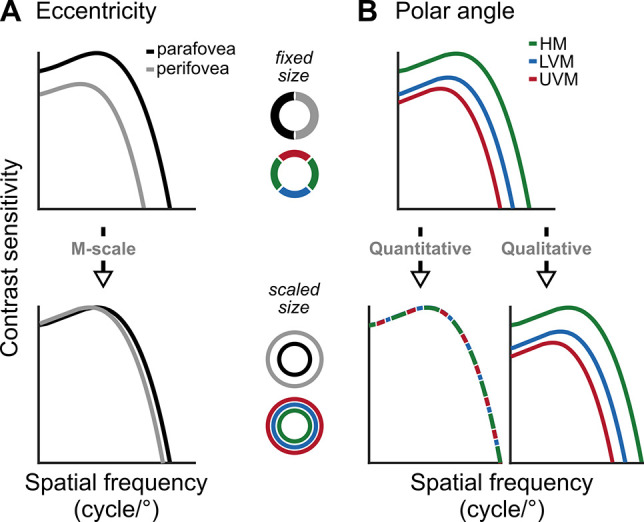
Figure 1. Schematic predictions of contrast sensitivity functions (CSFs).

(A) CSFs decline between the parafovea (2°) and perifovea (6°) for fixed-sized gratings (top row), but differences at low and medium SFs diminish after M-scaling Virsu and Rovamo, 1979 (bottom row). (B) CSFs differ among the horizontal meridian (HM), lower vertical meridian (LVM), and upper vertical meridian (UVM) for fixed-sized stimuli (top row). If polar angle asymmetries derive from differences in neural count among locations, M-scaling will diminish them (‘quantitative’ hypothesis). Alternatively, if the asymmetries derive from qualitatively different neural image-processing capabilities among locations, then M-scaling will not eliminate them (‘qualitative’ hypothesis).
