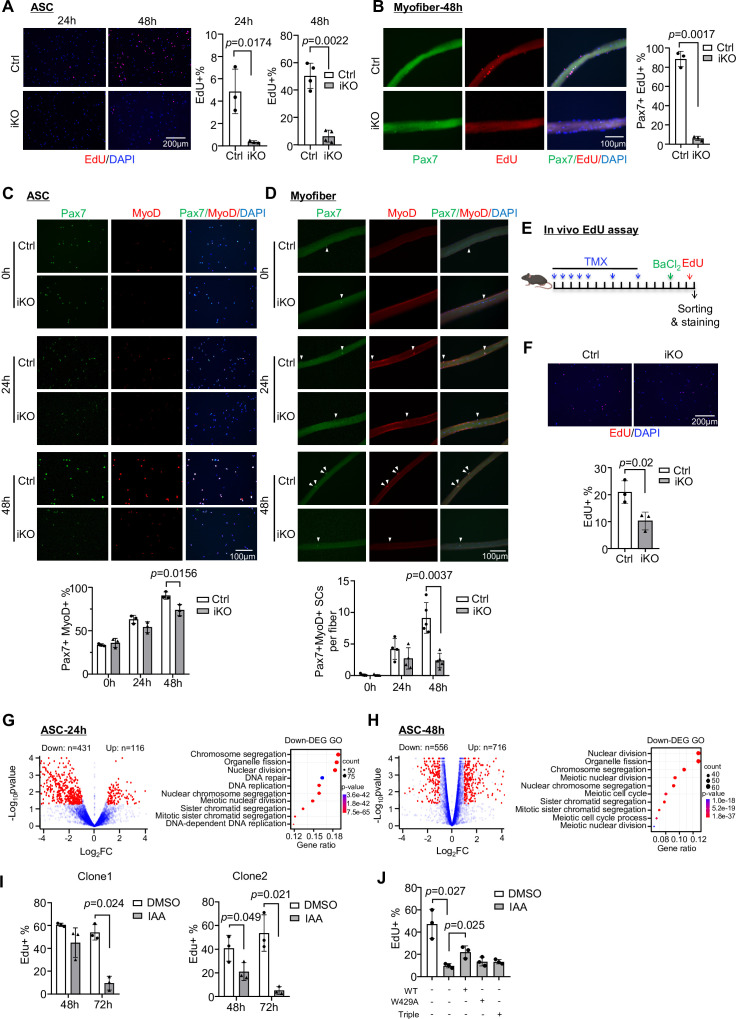
Figure 3. Inducible YTHDC1 knockout impairs satellite cell (SC) activation/proliferation.
(A) Left: EdU (red) staining of ASC-24 hr and ASC-48 hr from inducible knock out (iKO) and Ctrl mice. Scale bar = 200 μm. Right: quantification of the percentage of EdU+ cells. n = 3 mice per group for ASC-24 hr, n = 4 mice per group for ASC-48 hr. (B) Left: EdU (red) staining of EDL myofibers isolated from Ctrl or iKO mice and cultured for 48 hr. Scale bar = 100 μm. Right: quantification of the percentage of Pax7+ EdU+ SCs. n = 3 mice per group. (C) Top: immunofluorescence (IF) staining of Pax7 (green) and MyoD (red) of freshly isolated SCs (FISC) (0 hr), ASC-24 hr and ASC-48 hr from Ctrl and iKO mice. Scale bar = 100 μm. Bottom: quantification of the percentage of Pax7+ MyoD+ cells. n = 3 mice per group. (D) Top: IF staining of Pax7 (green) and MyoD (red) on EDL myofibers at 0 hr (freshly isolated), 24 hr, and 48 hr. Scale bar = 100 μm. Bottom: quantification of the number of Pax7+ MyoD+ cells per fiber (n = 4 mice per group for 0 and 24 hr, n = 5 mice per group for 48 hr). (E) Schematic illustration of in vivo EdU assay in Ctrl and iKO mice. (F) Top: EdU staining of the above freshly isolated and fixed SCs at 3 dpi. Scale bar = 200 μm. Bottom: quantification of the percentage of EdU+ cells in iKO vs. Ctrl. n = 3 mice per group. (G, H) Left: RNA-seq was performed in ASC-24 hr or -48 hr from iKO and Ctrl mice. Volcano plot showing the down- and upregulated genes in iKO vs. Ctrl. Right: GO analysis for the downregulated genes. (I) Two independent mAID-YTHDC1 cell lines were treated with DMSO or 5-Ph-IAA (IAA) for the indicated time. EdU assay was performed and the percentage of EdU+ cells was quantified at the designated time points. n = 3 replicates. (J) WT-YTHDC1, or a single (W429A), or a triple (K362A, S363A, and N364A) mutant of YTHDC1 lacking m6A binding ability was transfected with the mAID-YTHDC1 cells then treated with IAA. mAID-YTHDC1 cells treated with DMSO or IAA were used as control. EdU assay was then performed and the percentage of EdU+ cells was quantified. n = 3 replicates. Bars represent mean ± SD for all graphs. Statistical significance was determined using a two-tailed Student’s t-test.


