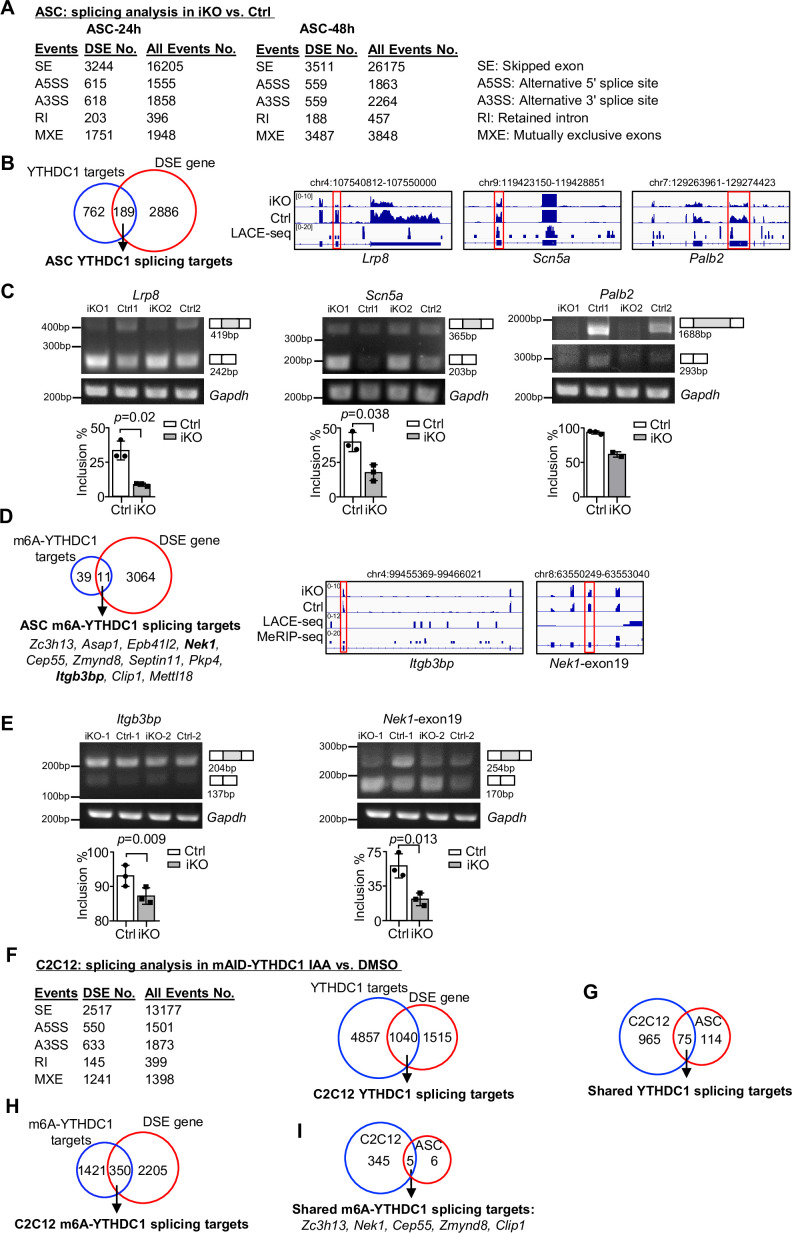
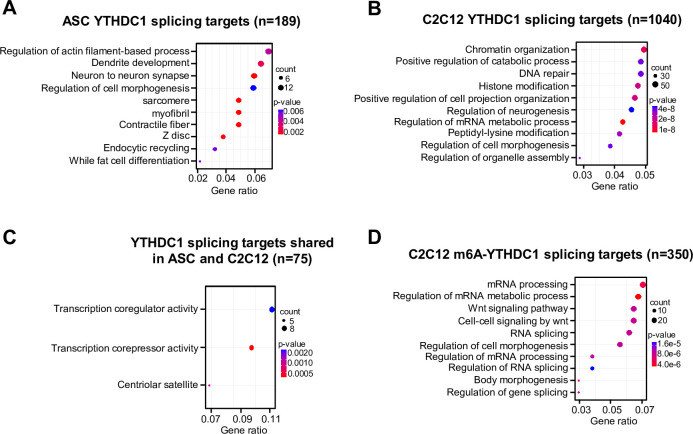
Figure 5. YTHDC1 depletion in ASCs leads to altered splicing events.
(A) Splicing analysis based on bulk RNA-seq data from ASC-24 hr or -48 hr defined five types of splicing events. The total number of each event in Ctrl, and the differential spliced events (DSE) in inducible knock out (iKO) vs. Ctrl are shown. (B) Left: combining the above ASC-48 hr DSEs with the ASC LACE-seq targets identified a total of 189 YTHDC1 splicing target mRNAs. Right: genome tracks of three selected targets. (C) Top: RT-PCR assay was performed in ASC-48 hr from YTHDC1-iKO and Ctrl to verify altered splicing of the three selected target mRNAs, Palb2, Lrp8, and Scn5a. Gapdh was used as a control. Bottom: quantification of exon inclusion level. Exon inclusion level was defined as the percentage of transcripts that includes the specific exon. Included/(included + skipped). n = 3 mice per group for Lrp8 and Scn5a. (D) Left: combining the above ASC-48 hr DSE with m6A-YTHDC1 targets uncovered 11 m6A-YTHDC1 splicing targets. Right: genome tracks of two selected targets. (E) Top: RT-PCR assay was performed in ASC-48 from YTHDC1-iKO and Ctrl to verify altered splicing of the two selected target mRNA, Itgb3bp, and Nek1. Gapdh was used as a control. Bottom: quantification of exon inclusion level. n = 3 mice per group. (F) Left: splicing analysis based on bulk RNA-seq data from C2C12-mAID-YTHDC1 cells with or without YTHDC1 degradation. Right: combining the above C2C12 DSEs with the C2C12 LACE-seq targets identified a total of 1040 YTHDC1 splicing target mRNAs. (G) Overlapping between the above-identified YTHDC1 splicing targets in ASC-48 hr and C2C12. (H) Combining the above C2C12 DSEs with m6A-YTHDC1 targets uncovered 350 m6A-YTHDC1 splicing targets. (I) Overlapping of m6A-YTHDC1 splicing targets in C2C12 and ASC-48 hr. Bars represent mean ± SD for all graphs. Statistical significance was determined using a two-tailed Student’s t-test.


