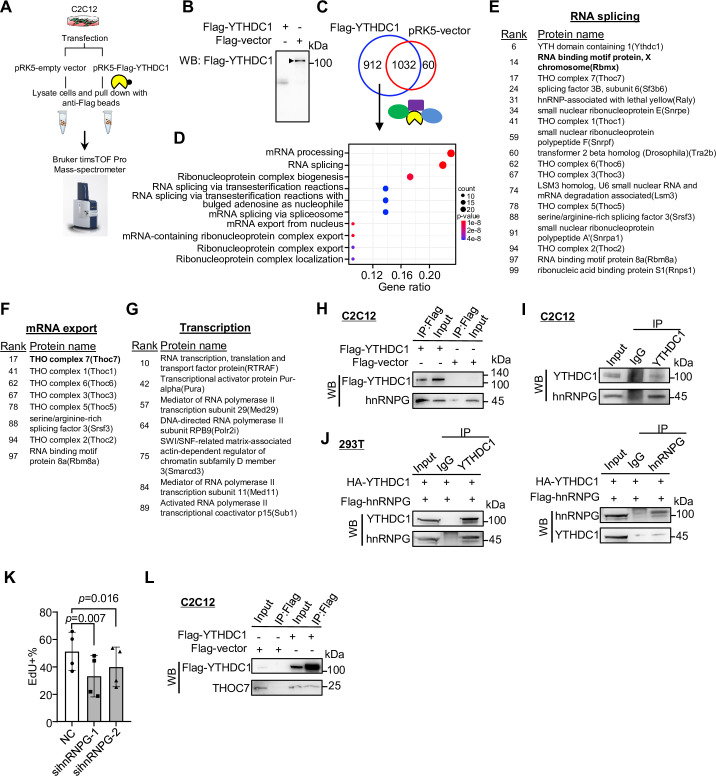
Figure 7. Co-immunoprecipitation/mass spectrometry (co-IP/MS) leads to the identification of YTHDC1 interacting partners.
(A, B) Schematic illustration of the co-IP/MS procedure. An empty vector or Flag-tagged YTHDC1 plasmid was expressed in C2C12 myoblasts followed by pull-down with Flag beads; the retrieved proteins were subject to MS with Bruker timsTOF Pro. (B) Overexpression of the Flag-tagged YTHDC1 was confirmed by western blotting (WB) using anti-Flag antibody. (C) 912 proteins were uniquely retrieved in YTHDC1 but not Vector-expressing cells. (D) GO functions of the above proteins are shown. (E–G) The above-identified interacting proteins with RNA splicing, mRNA export, or potential transcriptional regulatory functions are shown in the lists. (H) Flag-tagged YTHDC1 was overexpressed in C2C12 and Flag-beads-based IP was performed followed by WB to verify the retrieved hnRNPG protein. (I) IP of endogenous YTHDC1 protein in C2C12 myoblasts followed by WB to examine retrieved hnRNPG protein. (J) Flag-hnRNPG and HA-YTHDC were overexpressed in 293T cells; IP with YTHDC1 or hnRNPG protein flowed by WB to confirm the interaction between the two proteins. (K) Freshly isolated satellite cells (FISCs) were transfected with scramble or hnRNPG siRNA-1 or -2, and EdU assays were performed in ASC-48 hr. EdU+ cells were quantified. n = 4 replicates. Bars represent mean ± SD for all graphs. Statistical significance was determined using a two-tailed paired Student’s t-test. (L) Flag-tagged YTHDC1 was overexpressed in C2C12 and Flag beads-based IP was performed followed by WB to verify the interaction between YTHDC1 and THOC7.

