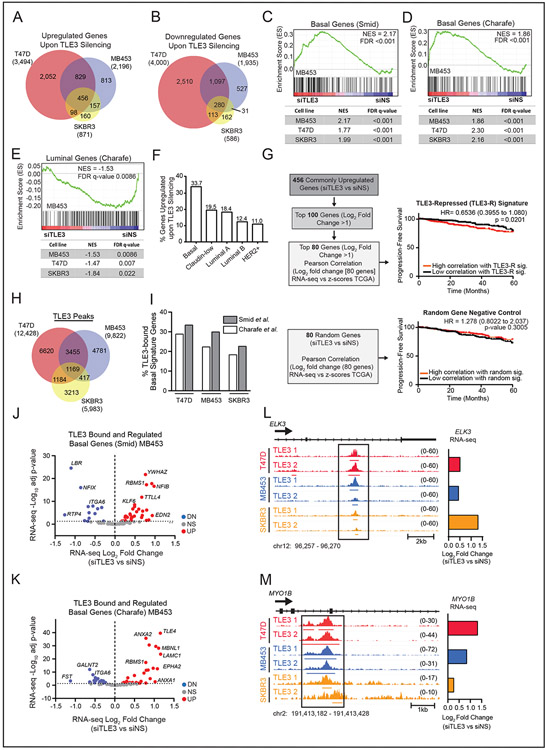
Figure 2. TLE3 directly represses basal signature genes.
A-B) Venn diagram of significantly A) upregulated and B) downregulated genes following TLE3 silencing for 48 hours in T47D, MDA-MB-453, and SKBR3 cells (p-adj < 0.05).
C-D) GSEA of changed gene expression from RNA-seq data using MDA-MB-453, T47D, and SKBR3 cells (siTLE3 vs. siNS) for basal signature genes derived from primary breast tumors C) SMID_BREAST_CANCER_BASAL_UP or from cell lines D) CHARAFE_BREAST_CANCER_LUMINAL_VS_BASAL_DN. GSEA for MDA-MB-453 are shown as representative enrichment plots.
E) GSEA of RNA-seq expression data from MDA-MB-453, T47D, and SKBR3 cell lines (siTLE3 vs. siNS) for CHARAFE_BREAST_CANCER_LUMINAL_VS_BASAL_UP MSigDB luminal signature gene set. GSEA of MDA-MB-453 data is shown as a representative enrichment plot.
F) Percent of genes upregulated with TLE3 silencing, classified as Basal, Claudin-Low, Luminal A, Luminal B, or HER2+ based on their highest expression level in the METABRIC dataset.
G) RNA-seq data from T47D, SKBR3, and MDA-MB-453 cells transiently transfected with siNS or siTLE3 for 48 hours was used to generate a TLE3-repressed (TLE3-R) gene signature. Expression of the TLE3-R gene signature was correlated with human tumor expression levels and progression-free survival up to 60 months (top) is reported. Survival curve for correlation with a random gene signature (negative control) (bottom).
H) Venn diagram of TLE3 ChIP-seq peak overlap in T47D, SKBR3, and MDA-MB-453 cells. The total number of peaks detected in each cell line is shown in parentheses.
I) Percent of TLE3 peaks that mapped to basal signature genes (defined by Smid and Charafe-Jauffret gene sets) in T47D, MDA-MB-453, and SKBR3 cells.
J-K) Volcano plot of basal genes within the Smid (J) and Charafe-Jauffret (K) signatures that are both bound (ChIP-seq) by TLE3 and significantly differentially expressed in response to TLE3 silencing (RNA-seq) in MDA-MB-453 cells. Red and blue symbols indicate statistically significant up- or downregulated expression, respectively (p-adj < 0.05).
L-M) ChIP-seq tracks of TLE3 binding in T47D, MDA-MB-453, and SKBR3 cells at basal signature genes, L) ELK3 and M) MYO1B. Height of peak tracks is shown in parentheses. Log2 fold changes as determined by RNA-seq (siTLE3 vs. siNS) are shown to the right.

