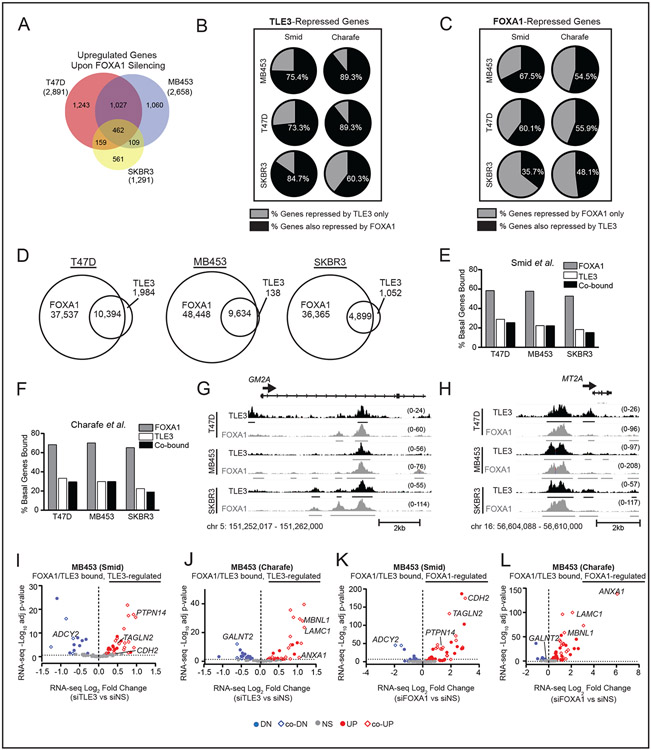
Figure 6. TLE3 collaborates with FOXA1 to repress BLBC signature genes.
A) Venn diagram of RNA-seq data for overlapping genes that are significantly upregulated in siFOXA1 vs. siNS T47D, SKBR3, and MDA-MB-453 cells (p-adj < 0.05). Total number of upregulated genes within each cell line are shown in parentheses.
B) Percent of TLE3-repressed (upregulated upon TLE3 silencing) BLBC signature genes defined by Smid or Charafe-Jauffret that are also repressed by FOXA1 (derived from RNA-seq data, p-adj < 0.05).
C) Percent of FOXA1-repressed BLBC genes that are also repressed by TLE3 (p-adj < 0.05).
D) Venn diagram showing the number of overlapping TLE3 and FOXA1 peaks in T47D, MB453, and SKBR3 cell lines.
E-F) Percent of basal signature genes bound by FOXA1, TLE3, or both in the E) Smid or F) Charafe-Jauffret signature gene lists.
G-H) Examples of TLE3 and FOXA1 overlapping peaks mapped to representative basal signature genes, G) GM2A and H) MT2A in T47D, MDA-MB-453, and SKBR3 cell lines. Peak height is shown in parentheses. n=2.
I-J) Volcano plot of basal signature genes defined by I) Smid or J) Charafe-Jauffret co-bound by TLE3 and FOXA1 that were differentially expressed in response to TLE3 silencing (RNA-seq data siTLE3 vs. siNS). Colored dots indicate significantly upregulated (red) or downregulated (blue) genes (p-adj < 0.05), while gray dots indicate genes not significantly changed.
K-L) Same as I-J but in response to FOXA1 silencing (RNA-seq data siFOXA1 vs. siNS, p-adj < 0.05).

