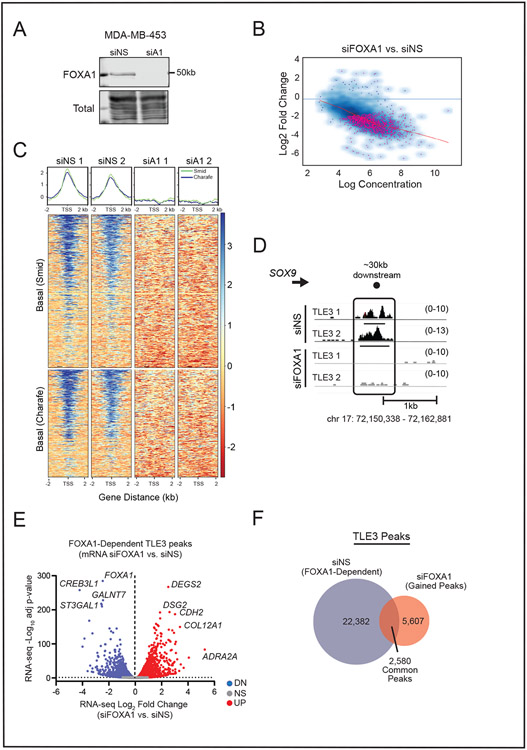
Figure 7. TLE3 binding sites are dictated by FOXA1.
A) Representative western blot confirming FOXA1 silencing in MDA-MB-453 cells after 48 hr.
B) Affinity plot showing 1,461 significantly different TLE3-bound regions between siNS and siFOXA1 samples (FDR < 0.05). Pink dots denote sites with significantly changed binding.
C) Density plots and heatmaps of TLE3 binding at basal signature genes as defined by Smid or Charafe-Jauffret in siNS vs. siFOXA1 (siA1) samples.
D) ChIP-seq tracks of TLE3 binding in siNS or siFOXA1 MDA-MB-453 cells at the SOX9 locus. Height of peak tracks is shown in parentheses.
E) Volcano plot of peaks specific to the siNS group and their change in gene expression following FOXA1 silencing after 48 hr (RNA-seq, p-adj < 0.05).
F) Venn diagram depicting TLE3 peaks common and unique to siNS or siFOXA1 samples.

