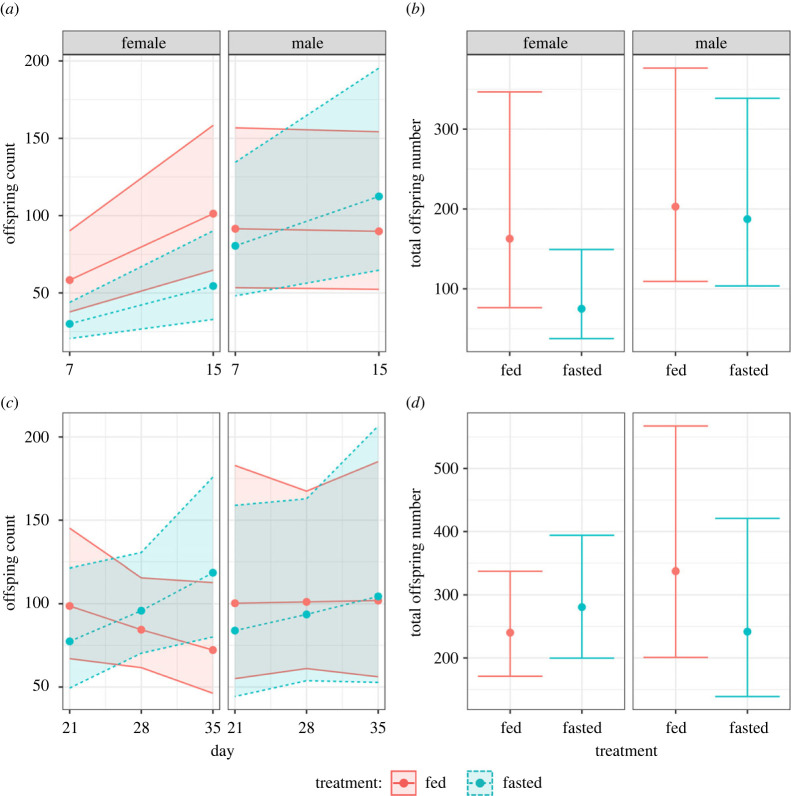
Figure 2.
(a,c) Age-specific reproduction. Colours represent fasted (blue, dashed lines) or fed (red, solid lines) dietary treatments in females (left) or males (right). Lines, points and 95% CIs represent predicted values from a linear model. (b,d) Total number of offspring in either female (left, red) or males (right, blue). Lines, points and 95% CIs represent predicted values from a linear model. (a,b) Reproduction whilst individuals are within their respective dietary treatments. (c,d) Reproduction when all individuals have been placed back into ad libitum.

