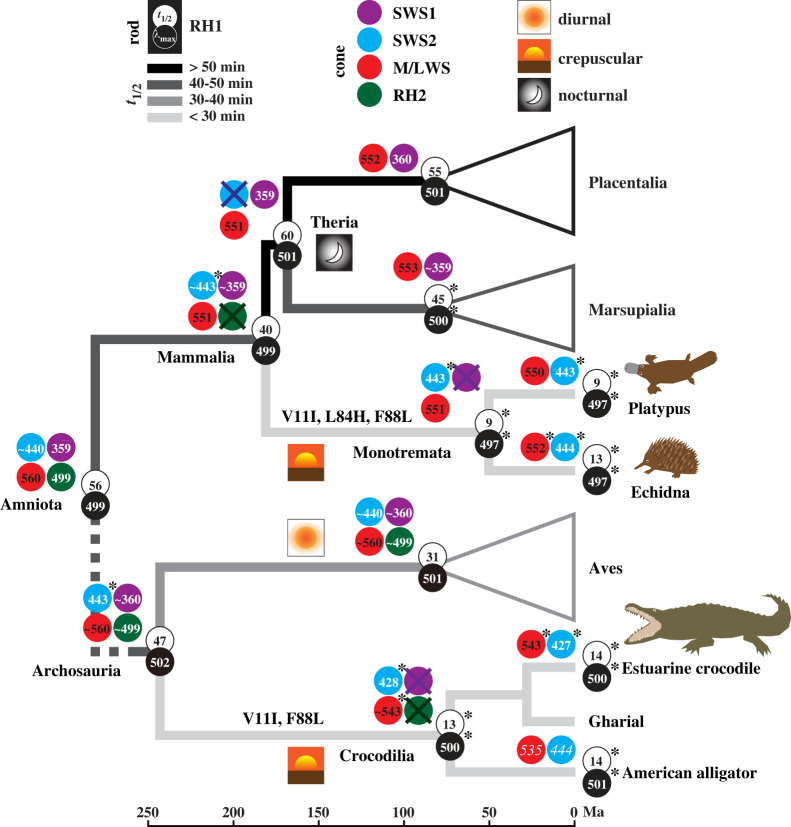
Figure 4.
Visual pigment evolution of monotreme and crocodilian ancestors. Branches are shaded from black to pale grey, scaled by faster retinal release rate, that is, smaller t1/2 values. A dashed line indicates the position of additional lineages (not shown) between the two ancestral nodes. Divergence times for early mammal lineages are based on Upham et al. [31]. Two of the three functionally critical sites shared by the ancestors of monotremes and crocodilians are shown. For λmax, white numbers are dark spectra, black are dark minus light difference spectra. Asterisks denote new measurements and other values are based on published data [7,17,20–22,40,42–44], with predicted values shown as tilde (∼) and two MSP values in italics [24].

