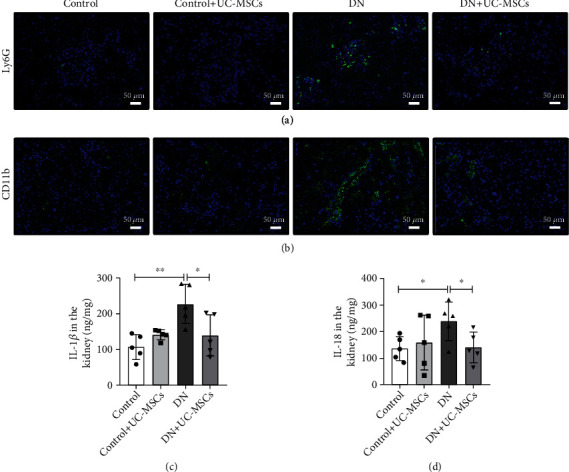
Figure 3.

UC-MSC administration inhibits inflammation in DN rats. (a, b) Immunofluorescence staining of Ly6G+ neutrophils or CD11b+ macrophages in kidney tissues is presented (n = 3 for each group). Scale bar, 50 μm. (c, d) ELISA analysis of IL-18 and IL-1β levels in kidney tissues from the control, control+UC-MSC, DN, and DN+UC-MSC groups. Data is shown as mean ± SD (n = 4). ANOVA was used for comparison among multiple groups. ∗p < 0.05 and ∗∗p < 0.01.
