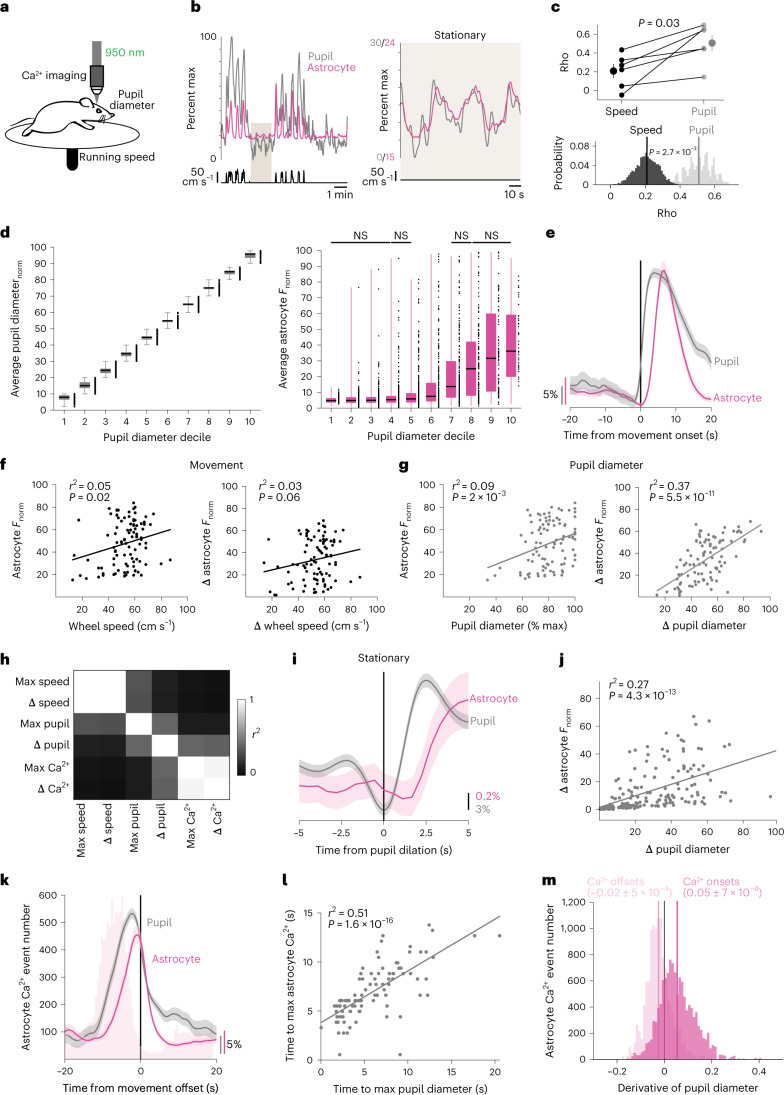
Fig. 1. Changes in arousal shape astrocyte Ca2+ activity independent of movement.
a, Experimental setup. b, Representative astrocyte Ca2+ (magenta), pupil diameter (gray) and wheel speed (black) show that these measures are closely related (left), even during stationary periods (right, smoothed with a five-frame window). Percent max indicates percent of maximum recorded value. c, Astrocyte Ca2+ correlates better with pupil diameter than speed when comparing across mice (top, two-sided signed-rank test) or using HB of recordings (n = 6 mice). Values of n are applied throughout the figure. d, Left: separating pupil diameter on the basis of size. Right: astrocyte Ca2+ was not different within low or high pupil sizes (n = 3,206 time bins, one-sided Kruskal–Wallis test, P > 0.05 indicated as NS, Supplementary Table 1). Box plot shows median and interquartile range (IQR). Whiskers extend to the most extreme data points. e, Astrocyte Ca2+ and pupil diameter dynamics aligned to mouse movement onset at t = 0 (n = 104 movement onsets). f,g, Linear regression (trend lines) of astrocyte Ca2+ and either wheel speed or pupil diameter, after movement onset (n = 104 movement onsets, two-sided t-test): neither maximum wheel speed (left) nor changes in wheel speed (right) correlate well with astrocyte Ca2+ responses (f); maximum pupil diameter (left) predicts astrocyte Ca2+ less strongly than changes in pupil diameter (right) (g). h, Heat map of r2 values between the variables in f and g. i, Astrocyte Ca2+ response to pupil dilation during stationary periods (n = 188 stationary dilations). j, Changes in stationary pupil diameter correlate with astrocyte Ca2+ (n = 188 stationary dilations, two-sided t-test). k, Astrocyte Ca2+ events (light-pink bars) begin before movement offset, but average astrocyte Ca2+ fluorescence (magenta trace) peaks with pupil diameter at the end of movement (n = 104 movement offsets). l, The latency to maximum astrocyte Ca2+ and pupil diameter after movement onset (n = 104 movement bouts, two-sided t-test) are correlated. m, Astrocyte Ca2+ events (n = 1.17 × 10⁴ astrocyte Ca2+ events) begin (dark pink) with pupil dilation (that is, when pupil derivative is positive) and end (light pink) with constriction (negative pupil derivative). Data are presented as mean ± s.e.m. unless otherwise noted.

