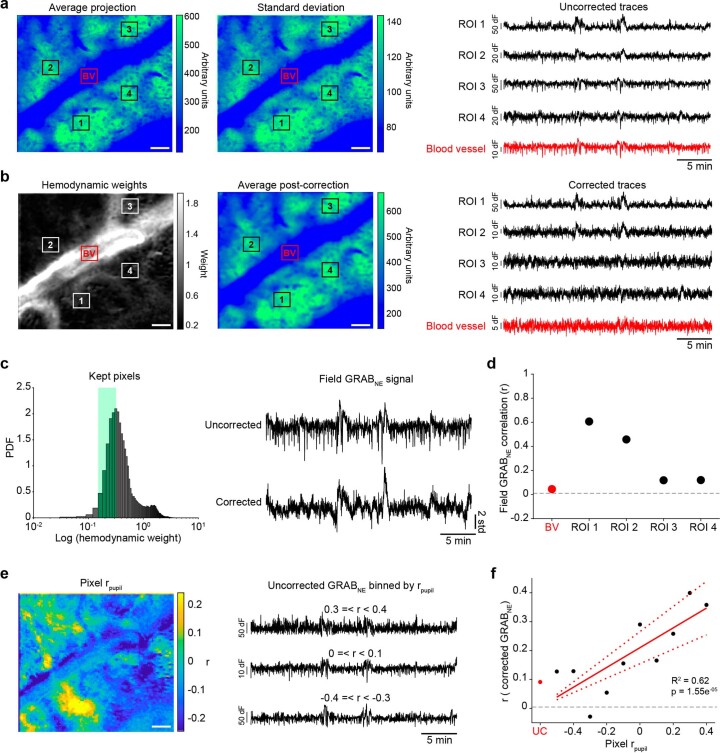
Extended Data Fig. 2. Hemodynamic correction of 2P GRABNE signals.
(a) Left: Average projection of a single GRABNE recording with four regions-of-interest (ROI) in areas with clear GRABNE fluorescence (black squares, labeled 1–4) and one ROI in a blood vessel (red square, labeled BV). Middle: standard deviation projection. Right: average fluorescence in each ROI before hemodynamic correction. (b) Left: Estimated hemodynamic signal present in each pixel. Middle: recovered average projection after hemodynamic correction. Note average fluorescence after hemodynamic correction is broadly similar the uncorrected data in (a) with some blurring due to Gaussian smoothing in preprocessing. Right: average ROI fluorescence after hemodynamic correction. (c) ROI-free methodology for obtaining GRABNE signal. Left: Following hemodynamic correction, the bottom quartile of pixels with the lowest hemodynamic weights, excluding the bottom 1% which often had artefactual signals, were kept. Right: These pixels were averaged together to produce the corrected GRABNE signal (bottom) which had substantially less hemodynamic contamination than the uncorrected field fluorescence (top). (d) Correlation between the corrected GRABNE signal and the uncorrected ROIs in (a) and (b). (e) Left: Correlation between uncorrected GRABNE fluorescence and pupil diameter. Right: Example traces from the average of pixels that were positively correlated (top), negatively correlated (bottom), or showed little relationship (middle) with pupil diameter. (f) The corrected GRABNE signal is not similar to the uncorrected GRABNE signal (red dot) but instead reflects the GRABNE signal of binned pixels (black dots) correlated to pupil diameter (R2 = 0.62, p = 1.55−5, two-sided t-test).

