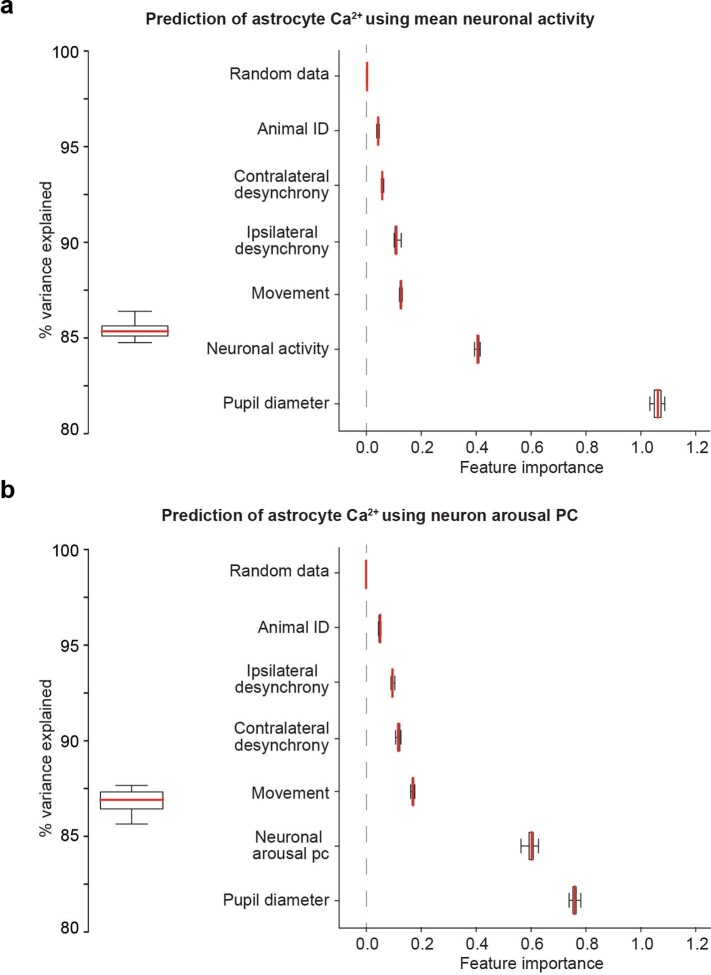
Extended Data Fig. 4. Analysis of contributions to astrocyte Ca2+.
(a) Left: A Random Forest Regression model was trained (80% of data, 2.3e4 samples) to predict (20% of data, 5.63 samples) average astrocyte Ca2+ fluorescence accurately (mean r2 = 0.85 ± 4.5e-3 std, n = 10 cross-validations). Right: Relative feature importance based on permutation testing of each predictor. Randomly generated data was included as a negative control and did not inform model predictions. (b) Same analysis as in (a), using the neuronal arousal PC rather than average neuronal activity. Random Forest Regression using the neuronal arousal PC showed a similar accuracy to that using mean neuronal fluorescence (mean r2 = 0.87 ± 6.4e-3 std, n = 10 cross-validations). Boxplots show median and IQR with whiskers to 1.5 * IQR.

