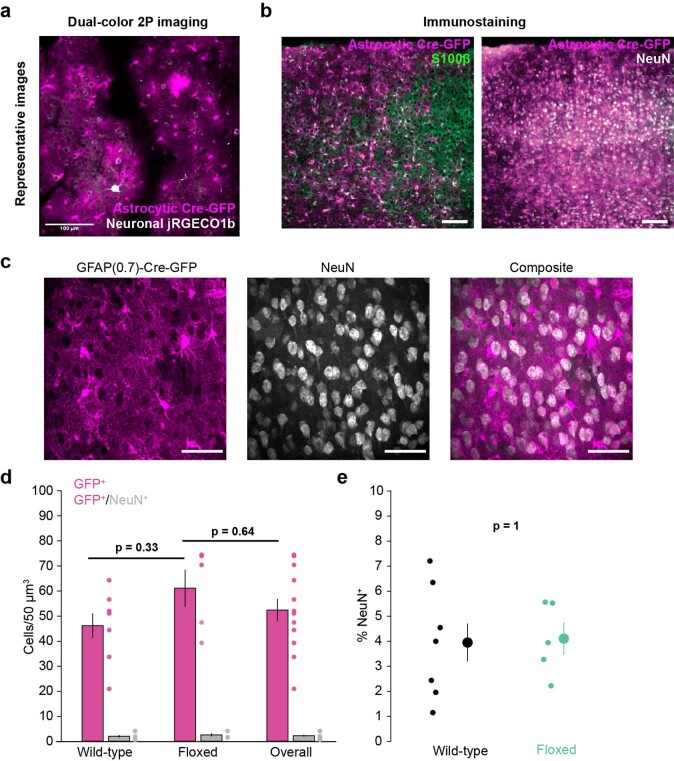
Extended Data Fig. 7. Astrocyte-specific Cre expression.
(a) Representative average 2 P image of in vivo neuronal jRGECO1b (gray) and astrocytes expressing Cre-GFP (magenta) (b) Example images show astrocyte-specific Cre-GFP (magenta) expression overlaps with the astrocyte marker S100β (left, green) but not the neuronal marker NeuN (right, grey), scale bar = 100 µm. (c) Representative mean-projection of a confocal 60x z-stack used for cell counting. Each animal had two sections with each section having six distinct field-of-views containing 20 z-planes. GFAP(0.7)-Cre-GFP expression (left) was highly astrocytic and the neuronal marker NeuN (middle) was rarely colocalized (right, scale bars = 50 µm). (d) Cre expression in neurons (grey bars) was low across genotypes (overall = 2.2 ± 0.39 neurons/50 µm3) and no difference was found between Cre expression in Adra1afl/fl mice and control mice or the cohort as a whole (One-sided Kruskal-Wallis test). (e) Cre-expressing neurons were rare in both wild-type (black, 4.0% ± 0.75%) and Adra1afl/fl mice (green, 4.1% ± 0.65%, two-sided ranked-sum test). (n = 7 Adra1afl/fl and n = 5 wild-type mice for all graphs. Data are presented as mean ± S.E.M.).

