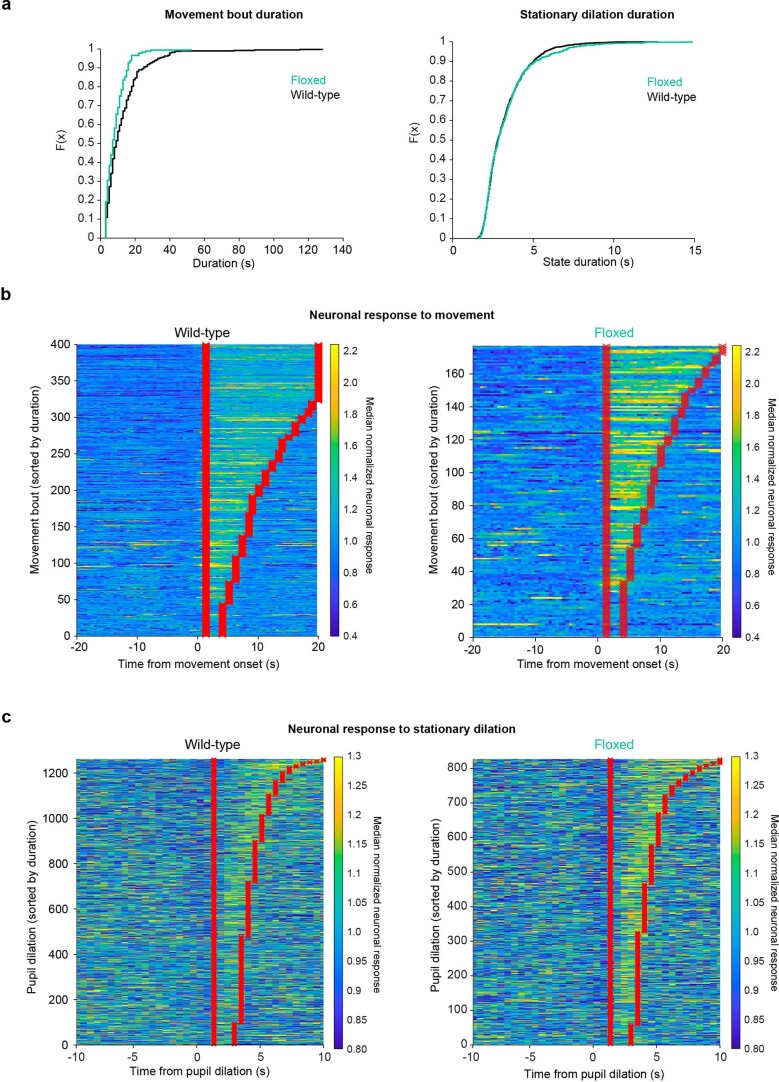
Extended Data Fig. 9. Quantification of arousal-associated neuronal activity.
(a) Cumulative distribution plots of the duration of movement bouts (left) and stationary pupil dilations (right) for wild-type (black, n = 400 movement bouts and 1396 pupil dilations) and Adra1afl/fl (green, n = 177 movement bouts and n = 923 pupil dilations) mice. (b) Analysis range (red) used to quantify the normalized arousal PC response to movement in wild-type (left) and Adra1afl/fl (right) mice. Each row represents one movement event, and the movements from all recordings and mice are concatenated to show the entire dataset (n = 4 wild-type mice and n = 4 Adra1afl/fl mice). (c) Same analysis as in (b), showing stationary pupil dilations in Adra1afl/fl mice compared to wild-type.

