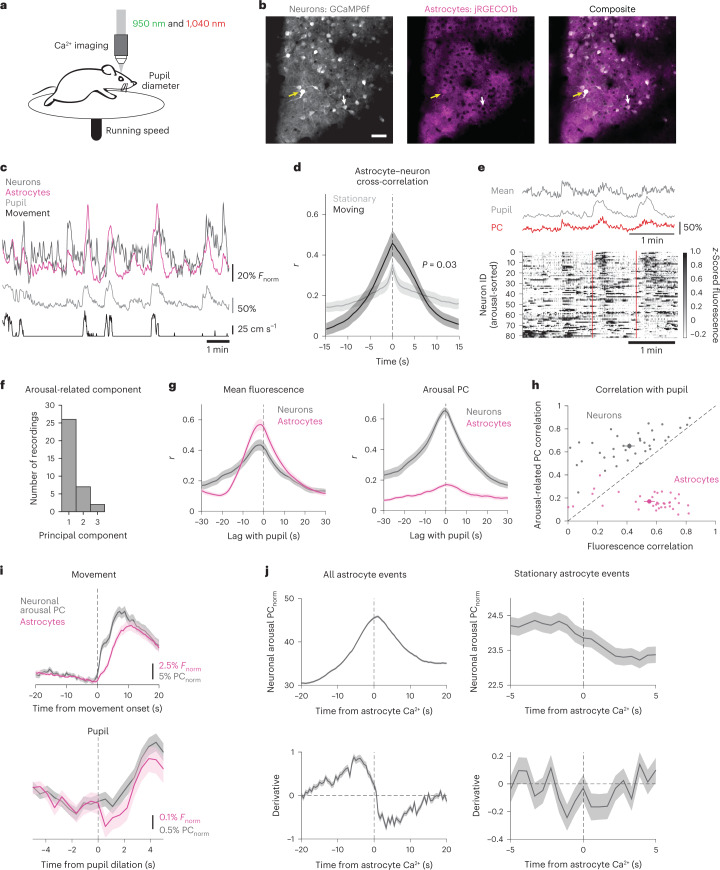
Fig. 3. Astrocyte Ca2+ is positioned to reduce effects of arousal on population-level neuronal activity.
a, Experimental paradigm for dual-color Ca2+ imaging of neurons and astrocytes. n = 33 recordings from eight mice throughout figure. b, 2P images from one recording of in vivo neuronal GCaMP6f (gray) and astrocyte jRGECO1b (magenta). Yellow arrows indicate bleed-through in the red channel which was accounted for (Methods), while white arrows show a neuron with no bleed through. Scale bar, 50 µm. c, Example of neuronal (dark gray) and astrocyte (magenta) Ca2+ activity, with pupil diameter (light gray) and wheel speed (black). d, Astrocyte and neuronal Ca2+ were positively correlated, and increased their correlation during movement compared with stationary periods (two-sided rank sum test). e, Top: an example of pupil diameter (light gray) fluctuations alongside changes in the neuronal mean fluorescence (dark gray) and arousal-associated PC of neuronal activity (red). Bottom: an example heat map of single-cell neuronal activity sorted by arousal PC weight shows that the arousal PC captured heterogeneous neuronal responses to arousal, including around movement events (red dashed lines). f, The component number of the arousal PC. g, Both neurons (gray) and astrocytes (pink) showed positive correlations between mean Ca2+ fluorescence and pupil diameter (left). Using PC analysis, we identified neuronal activity that showed strong correlation with pupil diameter, whereas astrocyte Ca2+ activity was not amenable to this analysis. h, Scatter plot of the correlation between either arousal PC (y axis) or mean fluorescence (x axis) for each recording. PC analysis identified arousal-associated neuronal activity for neurons (gray dots), but not astrocytes (magenta dots). i, Astrocyte Ca2 signaling (magenta) occurred alongside increases in arousal-associated neuronal activity (gray), and peaked with reductions in neuronal activity, for both movement (top, n = 134 movement bouts) and stationary increases in arousal (bottom, n = 772 pupil dilations). j, Top: arousal-associated neuronal activity tends to peak and then decrease around astrocyte Ca2+ activity both overall (left, n = 8.9e4 events) and during stationary periods (right, n = 3.2 × 10⁴ events). Bottom: the derivative of arousal-associated neuronal activity demonstrates that arousal-associated neuronal activity decreases directly following astrocyte Ca2+ events both overall (left) and during stationary periods (right). All data are presented as mean ± s.e.m. unless otherwise noted.

