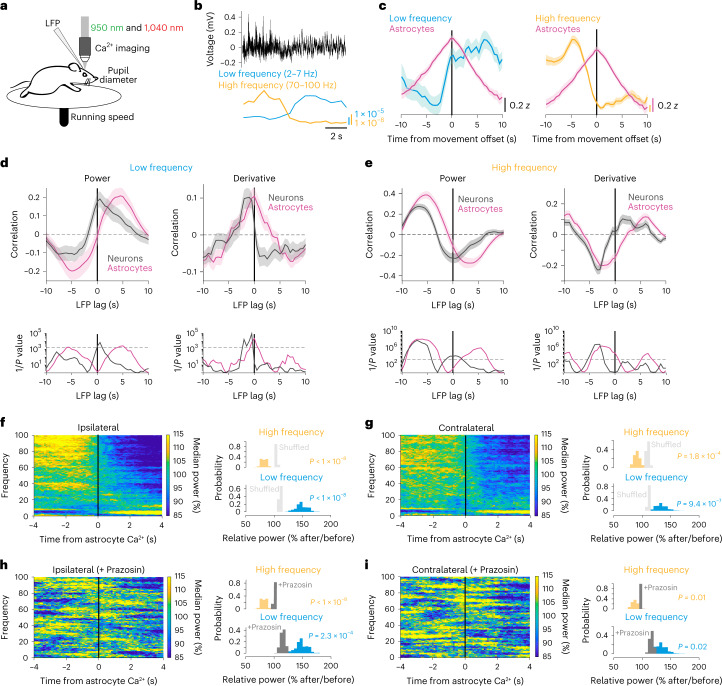
Fig. 5. NE-dependent astrocyte Ca2+ occurs at the crux of cortical state changes.
a, Experimental setup. b, Example LFP data (black) with calculated LF (2–7 Hz, blue) and HF (70–100 Hz, orange) power. c, Average LFP LF (left) and HF (right) power with astrocyte Ca2+ activity (magenta) around movement offset at t = 0 s (n = 52 offsets from four mice). d, Top: cross-correlation between astrocyte (magenta) or neuronal Ca2+ (gray) activity and LF power (left), or the derivative of LF power (right). Bottom: significance (1/P, two-sided signed-rank test) for astrocytes and neurons. Dashed line is the threshold of correction for multiple comparison. e, HF power and its derivative are cross-correlated to neuronal and astrocyte Ca2+, as for LF power in d. Neuronal Ca2+ correlated with LFP power, while astrocyte Ca2+ correlated with the derivative of LFP power. f,g, LFP power dynamics in ipsilateral (f) and contralateral (g) cortex, centered around astrocyte Ca2+ onsets at t = 0 s. LFP power in a 5 s window around astrocyte Ca2+ events was computed, and each frequency was normalized by its median power. (All p-values from one-sided HB). Left: astrocyte Ca2+ events occur at the crux of ipsilateral (f, n = 4 mice) and contralateral (g, n = 5 mice) LFP state transitions from HF- to LF-dominated states. Comparisons are made using HB between empirical data (colored bars) and shuffled distributions (light gray). Right: HF power decreased (orange) and LF power (blue) increased after astrocyte Ca2+ events. h,i, This relationship was abolished in both ipsilateral (h) and contralateral (i) cortical LFP recordings after administration of the Adra1 receptor antagonist Prazosin (5 mg kg−1, i.p., n = 4 mice), for both LF and HF power (comparisons are made using HB between state changes without Prazosin (colored bars) and with the addition of Prazosin (dark gray). Line plots are presented as mean ± s.e.m.

