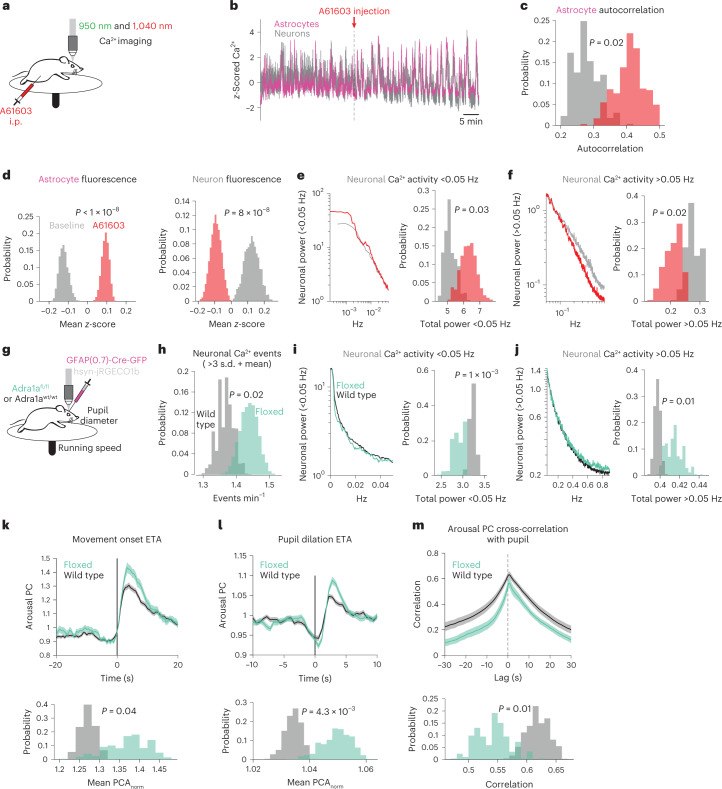
Fig. 6. Adra1a receptors modulate basal neuronal activity and neuronal population responses to arousal.
a, Experimental schematic for dual-color imaging with in vivo pharmacology. b, A striking example of population astrocyte (magenta) and neuron (gray) Ca2+ activity in response to A61603 (10 µg kg−1, i.p.). c–f, Histograms show differences between metrics at baseline (gray) or after A61603 (red) using HB (n = 4 mice in c–g): astrocyte Ca2+ activity became more homogeneous as measured by autocorrelation (c); astrocytes (left) showed increased population Ca2+ fluorescence while neurons (right) showed decreased population Ca2+ fluorescence after A61603 administration (d); neuronal activity power spectra <0.05 Hz (left) showed more power after A61603 injection (right, HB) (e); same as in e for power >0.05 Hz (f). g, Schematic for neuronal Ca2+ imaging in homozygous Adra1afl/fl mice and wild-type littermate controls; all mice were injected with GFAP-Cre (n = 4 Adra1afl/fl and four wild-type littermate controls in h–l). h, Overall, neuronal activity was increased in Adra1afl/fl mice (green) relative to wild type (gray). i,j, Neuronal activity <0.05 Hz was decreased and neuronal activity >0.05 Hz was increased in Adra1afl/fl mice. k, Arousal-associated neuronal activity was increased following movement in Adra1afl/fl mice (green, n = 177 movement bouts) compared with wild type (gray, n = 400). l, Adra1afl/fl mice (green, n = 923 pupil dilations) showed increased arousal-associated neuronal activity compared with wild type (gray, n = 1,396 pupil dilations) following stationary increases in pupil diameter. m, Arousal-associated neuronal activity was less correlated with the pupil diameter overall in Adra1afl/fl (green, n = 23 recordings) compared with wild-type mice (gray, n = 14 recordings). For all panels, histograms show HB distributions (n = 4 Adra1afl/fl and 4 wild-type littermate controls). All line plots are presented as mean ± s.e.m. and P values from histograms show one-sided HB tests.

