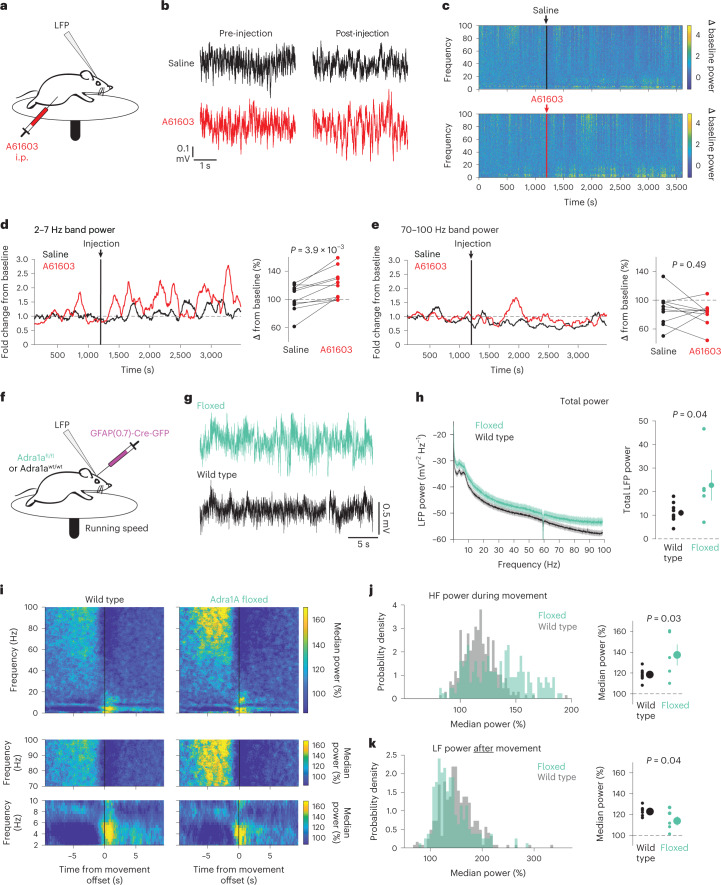
Fig. 7. Genetic removal of astrocyte Arda1a impairs cortical resynchronization after arousal.
a, Experimental setup for LFP recording with in vivo pharmacology. b, Example cortical LFP data following i.p. injections of either saline (black) or the Adra1a-specific agonist A61603 (1 µg kg−1, red). c, Representative spectrograms from saline-injected (top) and A61603 -injected (bottom) mice. Arrows and vertical lines indicate time of injection. d, Left: example of 2–7 Hz band power change with saline or A61603 injection, smoothed with a 2 min moving average. Right: A61603 increased LF power compared with saline (two-sided signed-rank test, n = 10 mice). e, Left: representative trace of 70–100 Hz band power with saline or A61603 injection. Right: A61603 did not affect HF power compared with saline (two-sided signed-rank test, n = 10 mice). f, LFP recordings were performed in homozygous Adra1afl/fl mice and wild-type littermate controls; all mice were injected with GFAP-Cre. g, Representative 30 s of LFP data from Adra1afl/fl (green) and wild-type (black) mice. h, Average LFP spectra from Adra1afl/fl (n = 5) and wild-type (n = 9) mice, with total LFP power higher in Adra1afl/fl mice (two-sided t-test, shaded region shows theoretical error bars with P = 0.05). i, Average LFP spectrograms around movement offset (t = 0 s) for wild-type (left) and Adra1afl/fl (right) mice. Data are normalized by the median power at each frequency to show state-related changes in LFP. Top: entire spectrograms from 0–100 Hz. Middle: 70–100 Hz range showing increased power in Adra1afl/fl mice compared with wild type during movement. Bottom: 2–7 Hz range showing reduced power after movement offset in Adra1afl/fl mice. j, There was increased 70–100 Hz power in Adra1afl/fl mice during movement (left, n = 303 wild-type and 194 Adra1afl/fl movement offsets) between cohorts (right, n = 5 Adra1afl/fl and 9 wild-type mice, two-sided t-test). k, Same as in j for 2–7 Hz power after mice stopped moving. For all scatter plots, individual data are plotted as mean ± s.e.m.

