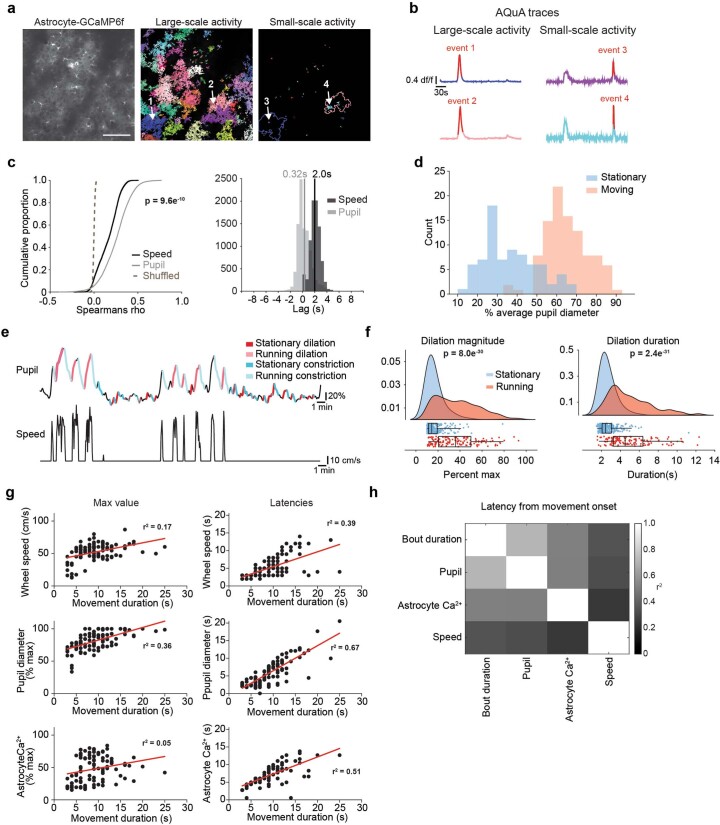
Extended Data Fig. 1. Dissection of astrocyte Ca2+ and behavioral state.
(a) Representative 2P mean projection image from one ten-minute recording of in vivo astrocyte GcaMP6f (left, scale bar = 100 µm). AQuA detected both large (middle) and small (right) astrocyte Ca2+ events within the entire movie, even when they were spatially overlapping. Arrows indicate two pairs of spatially overlapping events (arrows 1 and 3, and arrows 2 and 4).(b) Traces from the AQuA events shown in (a), with the time period of the AQuA-detected event highlighted in red. (c) Related to Fig. 1c: Individual astrocyte Ca2+ events correlated better with pupil diameter (left, n = 1.2e4 Ca2+ events, One-sided Kruskal-Wallis test) and had a shorter lag with pupil diameter than wheel speed (right, pupil n = 9.6e3, wheel n = 8.3e3, rank-sum test). (d) Related to Fig. 1d: average pupil diameter during movement (n = 100) and stationary periods (n = 76). (e) Classification of behavioral state by both pupil diameter and movement. (f) Pupil dilation is smaller (left) and shorter (right, rank-sum tests) during stationary periods (n = 261 dilations, blue) compared with movement-associated dilations (n = 136 dilations, red, boxplots show median and IQR with whiskers to 1.5 * IQR, two-sided Rank Sum test). (g) Related to Fig. 1l: Left: Movement duration (n = 104) was related to the maximum wheel speed (top) and pupil diameter (middle), but not to the maximum astrocyte Ca2+ (bottom). Right: the latency to the maximum wheel speed (top), pupil diameter (middle), and astrocyte Ca2+ (bottom) were strongly linked to movement duration. (h) Heatmap summary of the r2 between the latencies in (g) right, and movement bout duration.

