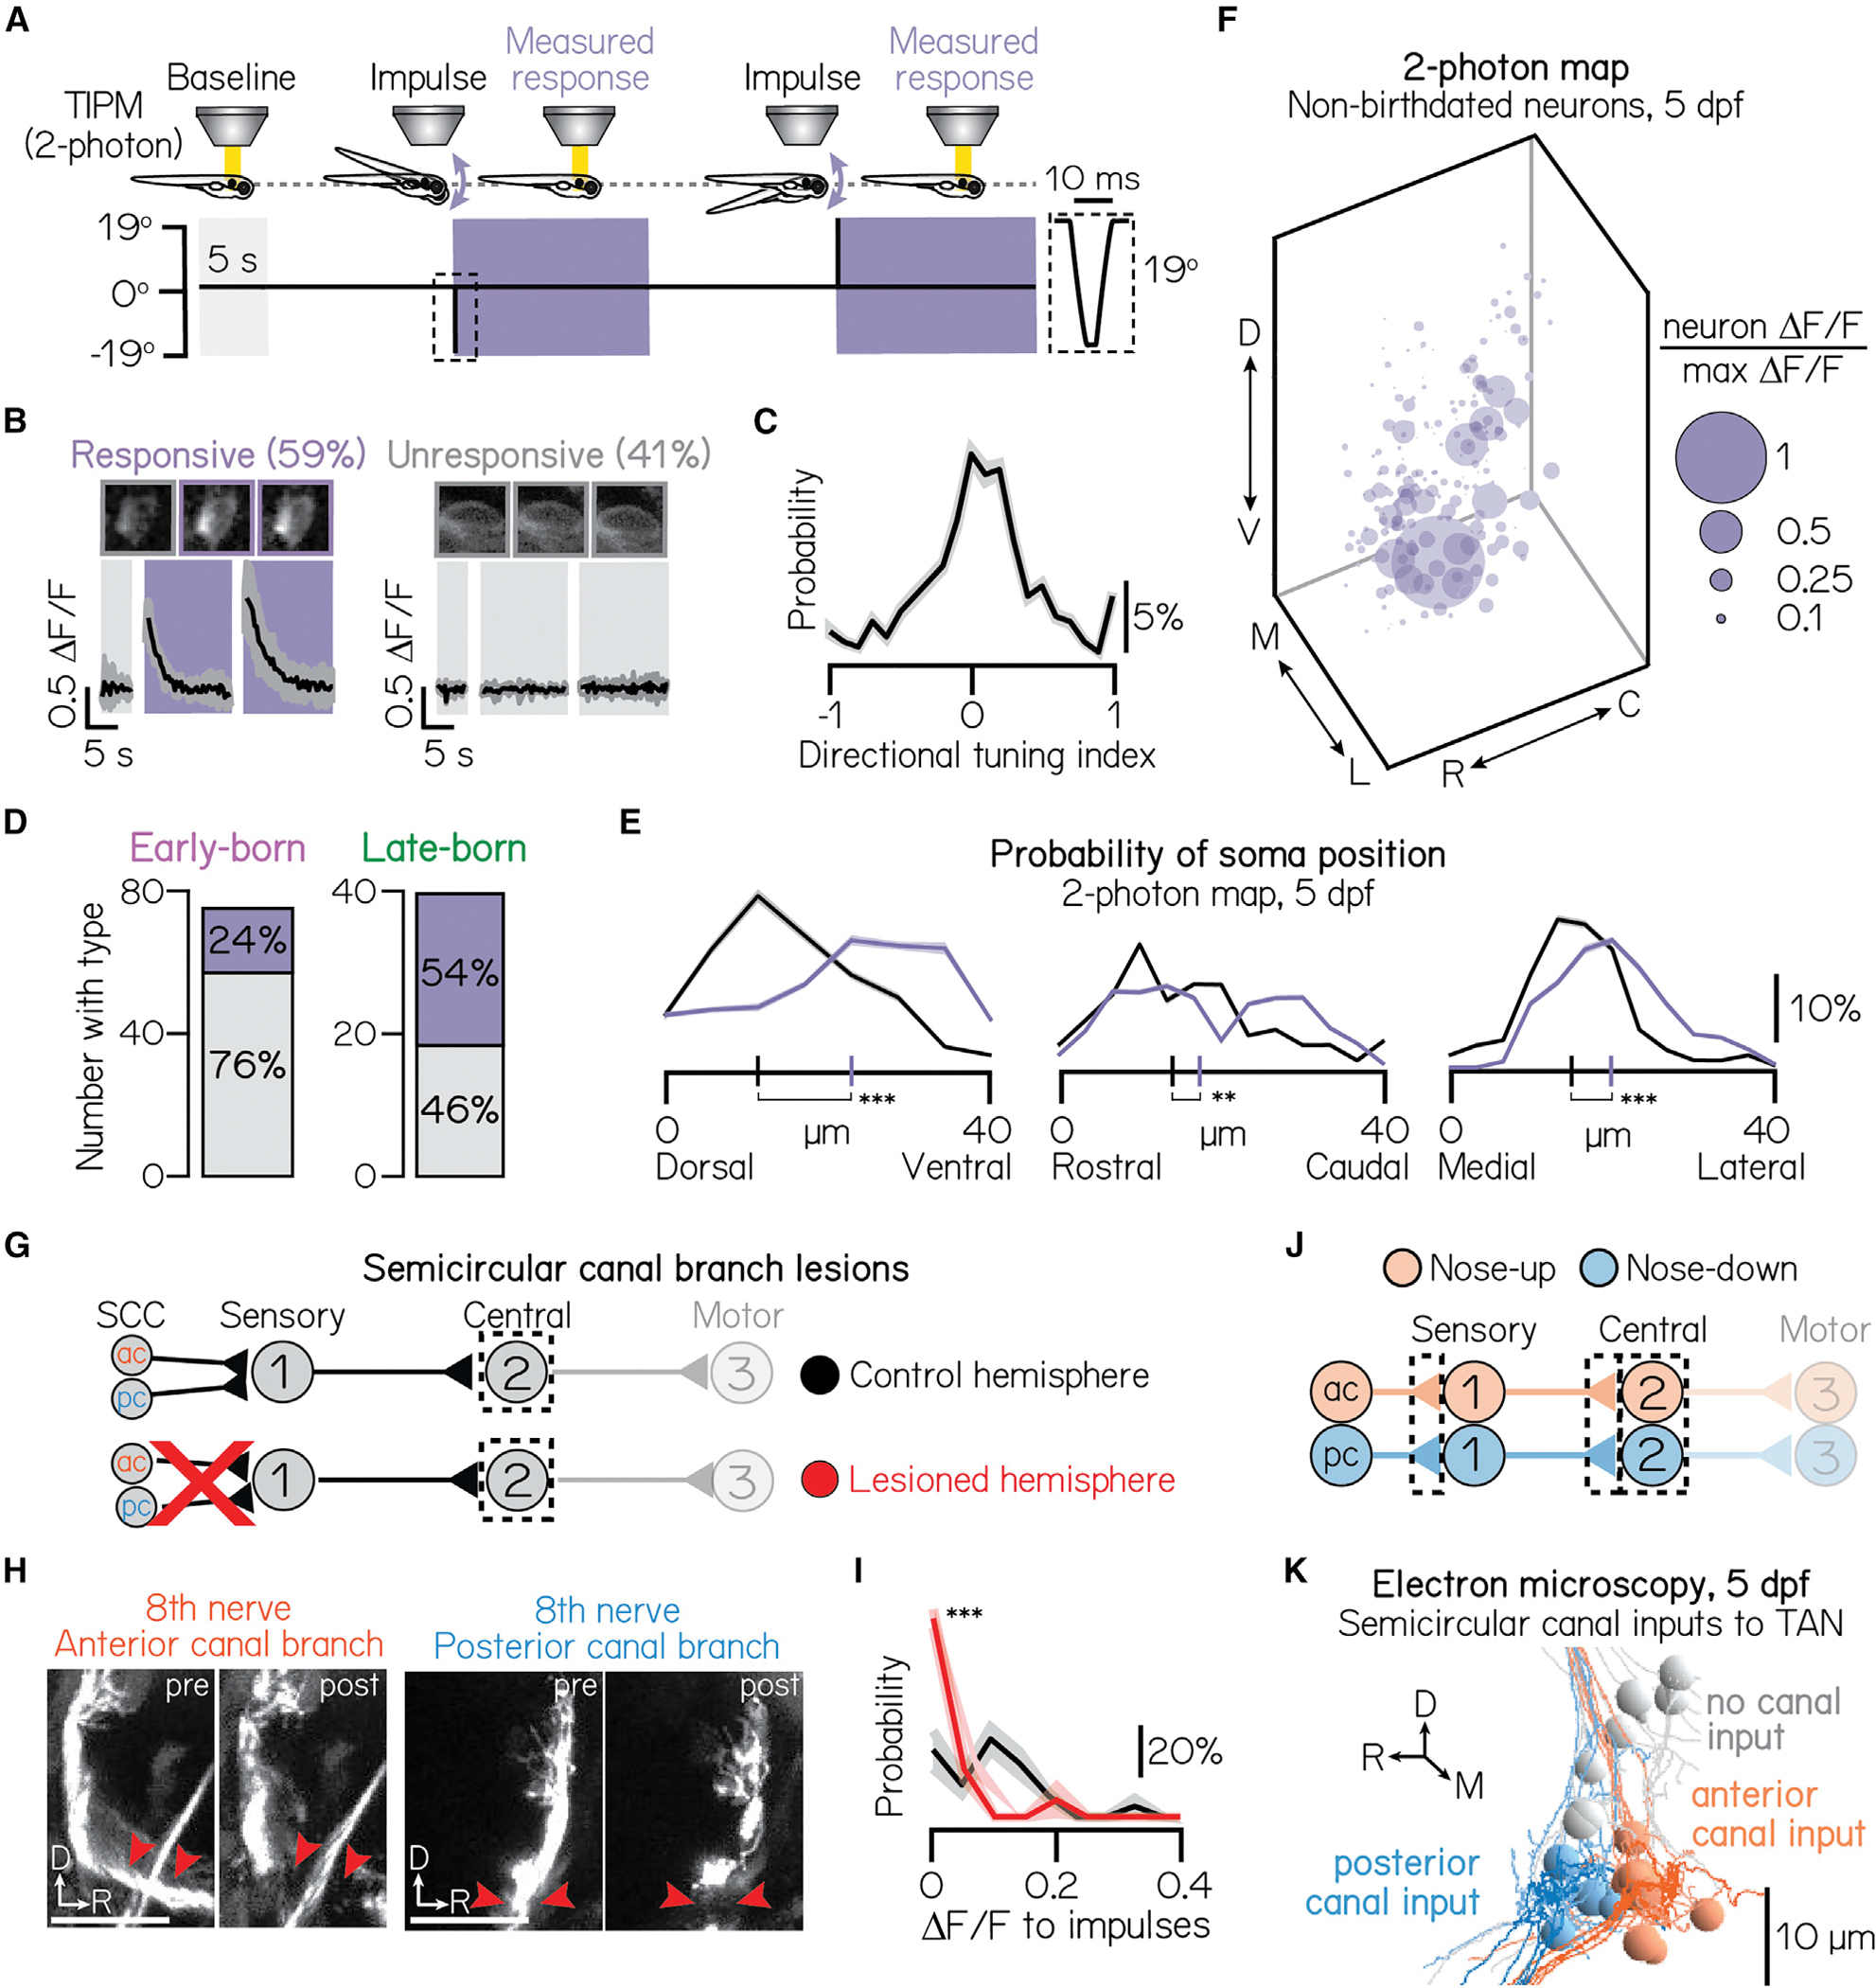
Figure 5. Birthdate reveals topography to semicircular canal-mediated, high-frequency stimulation responses.

(A) Impulse stimulus waveform. Shaded bars indicate time in the horizontal calcium imaging plane. Dotted box shows zoom of 10 ms impulse.
(B) Example traces from an impulse-responsive (left) and unresponsive (right) projection neuron. Parentheses show percent of neurons in sample. Same n = 467 neurons, N = 22 fish as Figure 2D.
(C) Probability of directional selectivity to impulses. Zero indicates no directional preference. Distribution shows mean (solid line) and standard deviation (shaded outline) from jackknife resampling.
(D) Number of early- and late-born projection neurons with (purple) or without (gray) impulse responses (purple). Data from same fish as in Figures 1G and 1H.
(E) Probability of soma position for impulse-responsive (purple) or unresponsive (gray) neurons from non-birthdated, two-photon TIPM; same n = 467 neurons, N = 22 fish as Figure 2D. Short vertical axis lines indicate the median position.
(F) Soma position of impulse-responsive neurons, scaled by impulse response strength (Δ F/F) relative to the strongest response observed. Larger circles indicate stronger responses. Data from the same neurons shown in Figure 3G.
(G) Circuit schematic. Both the anterior and posterior semicircular canal branches of the VIIIth nerve are uni-laterally lesioned. Calcium responses of projection neurons (black dashed box) in lesioned and control hemispheres are compared.
(H) Example images from larvae before and after unilateral VIIIth nerve lesions. Left and right image sets (replicated from Figure S3E) show the anterior and posterior semicircular canal branches, respectively, before and after lesion. Both branches are lesioned in each experiment. Red arrows point to lesion sites. VIIIth nerve visualized using the Tg(−17.6isl2b:GFP) line; larvae also expressed Tg(−6.7Tru.Hcrtr2:GAL4-VP16; UAS:GCaMP6s) for projection neuron calcium imaging.
(I) Probability distributions of the maximum Δ F/F response to impulse rotations in lesioned (red) and control (black) hemispheres. Responses shown only for the most ventral 15 μm of projection neurons. Solid lines show mean from jackknife resampling; shaded bars, standard deviation. Control: n = 68 impulse responses, N = 3 fish. Lesioned: n = 132 impulse responses, N = 3 fish.
(J) Circuit schematic for electron microscopy experiments. Black dashed lines indicate the circuit elements of focus: synaptic connections from the anterior and posterior semicircular canals to first-order sensory neurons, synaptic connections from sensory neurons to projection neurons, and projection neurons.
(K) Electron microscopy reconstruction of 19 projection neurons at 5 dpf. Soma pseudocolored based on innervation from sensory neurons that receive anterior semicircular canal input (orange) or posterior semicircular canal input (blue). Gray soma receive no semicircular canal input. All panels: ***difference at the p < 0.001 level; **significance at p < 0.01.
See also Table S1.
