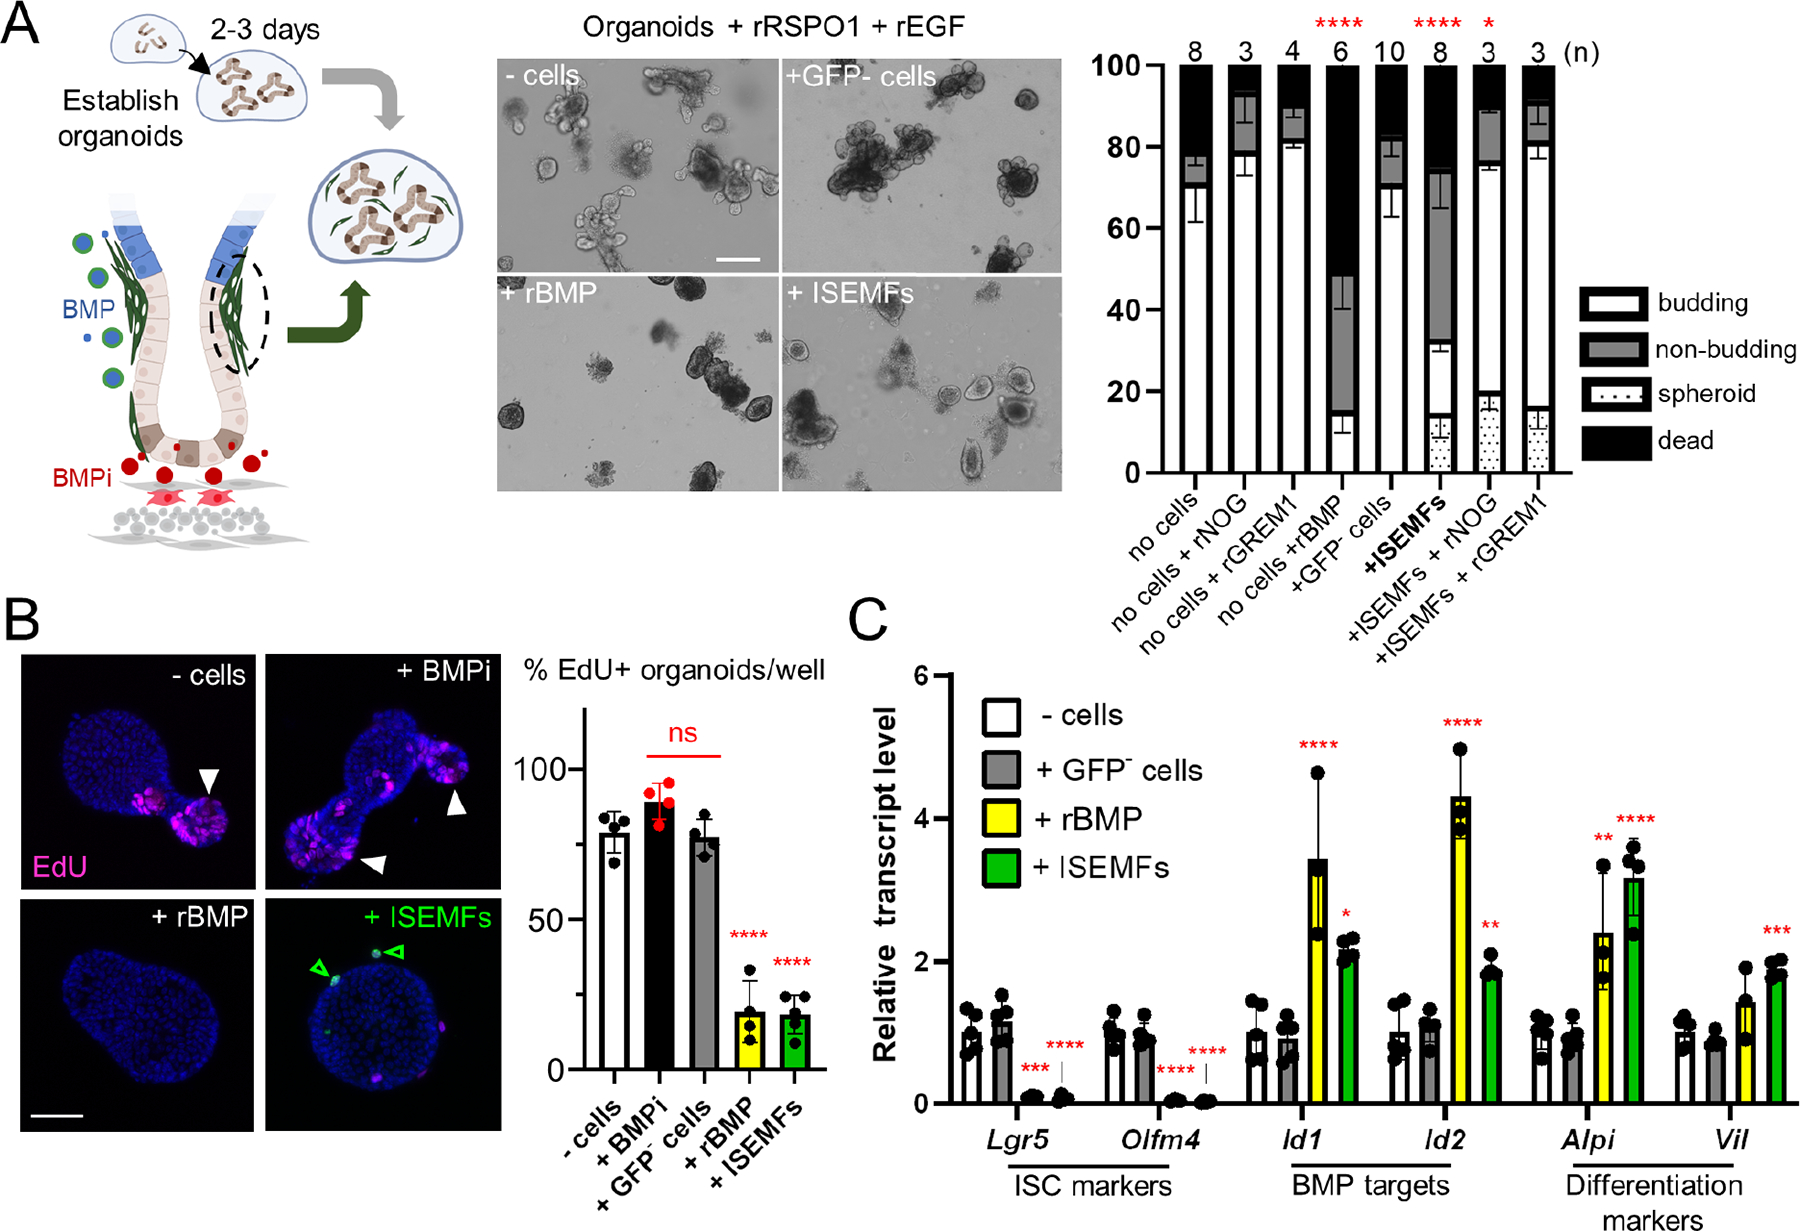
Figure 1. ISEMFs promote epithelial differentiation in vitro.

A) Two- to 3-day old established organoids cultured with recombinant (r) RSPO1, EGF, and indicated cell types from PdgfraH2B-eGFP mouse SI. The diagram depicts ISEMFs (green) and trophocytes (red) as BMP and BMPi sources, respectively. Representative organoids are shown 48 h later (scale bar 100 μm). Co-cultures without cells or with GFP− (PDGFRA−) cells produced budding structures, whereas crypts co-cultured with ISEMFs or rBMPs retracted their buds, a process that reversed in the presence of BMPi rNOG or rGREM1. The graph represents fractions of budding (white), unbranched (non-budding, grey), fully spheroidal (stippled), and non-viable (black) organoids after co-culture with the indicated cells or factors. Statistics for budding fractions were determined by one-way ANOVA followed by Dunnett’s posttest. *p <0.05, ****p <0.0001 (n=3–10 independent organoid cultures as indicated above each bar).
B) Representative images of organoid EdU uptake and quantitation (percent EdU+ organoids per condition). Cell replication is markedly reduced in organoids co-cultured with ISEMFs or rBMPs. White arrowheads: organoid buds with EdU+ cells, green arrowheads: live GFPhi ISEMFs, additional examples in Figure S1B. Scale bar 50 μm. Statistics, reported relative to crypt cultures without added cells, were determined by one-way ANOVA followed by Tukey’s multiple comparisons test. ****P <0.0001, ns: not significant.
C) qRT-PCR analysis of organoids after 48 h co-culture (n=3 or 4 biological replicates). BMP- or ISEMF-exposed organoids reduced expression of ISC markers and increased markers of BMP activation and epithelial differentiation. Transcript levels are represented relative to control crypt cultures with no added cells. Statistical comparisons use one-way ANOVA followed by Dunnett’s posttest. ****P <0.0001, ***P <0.001, **P <0.01, *P <0.05.
See also Figure S1.
