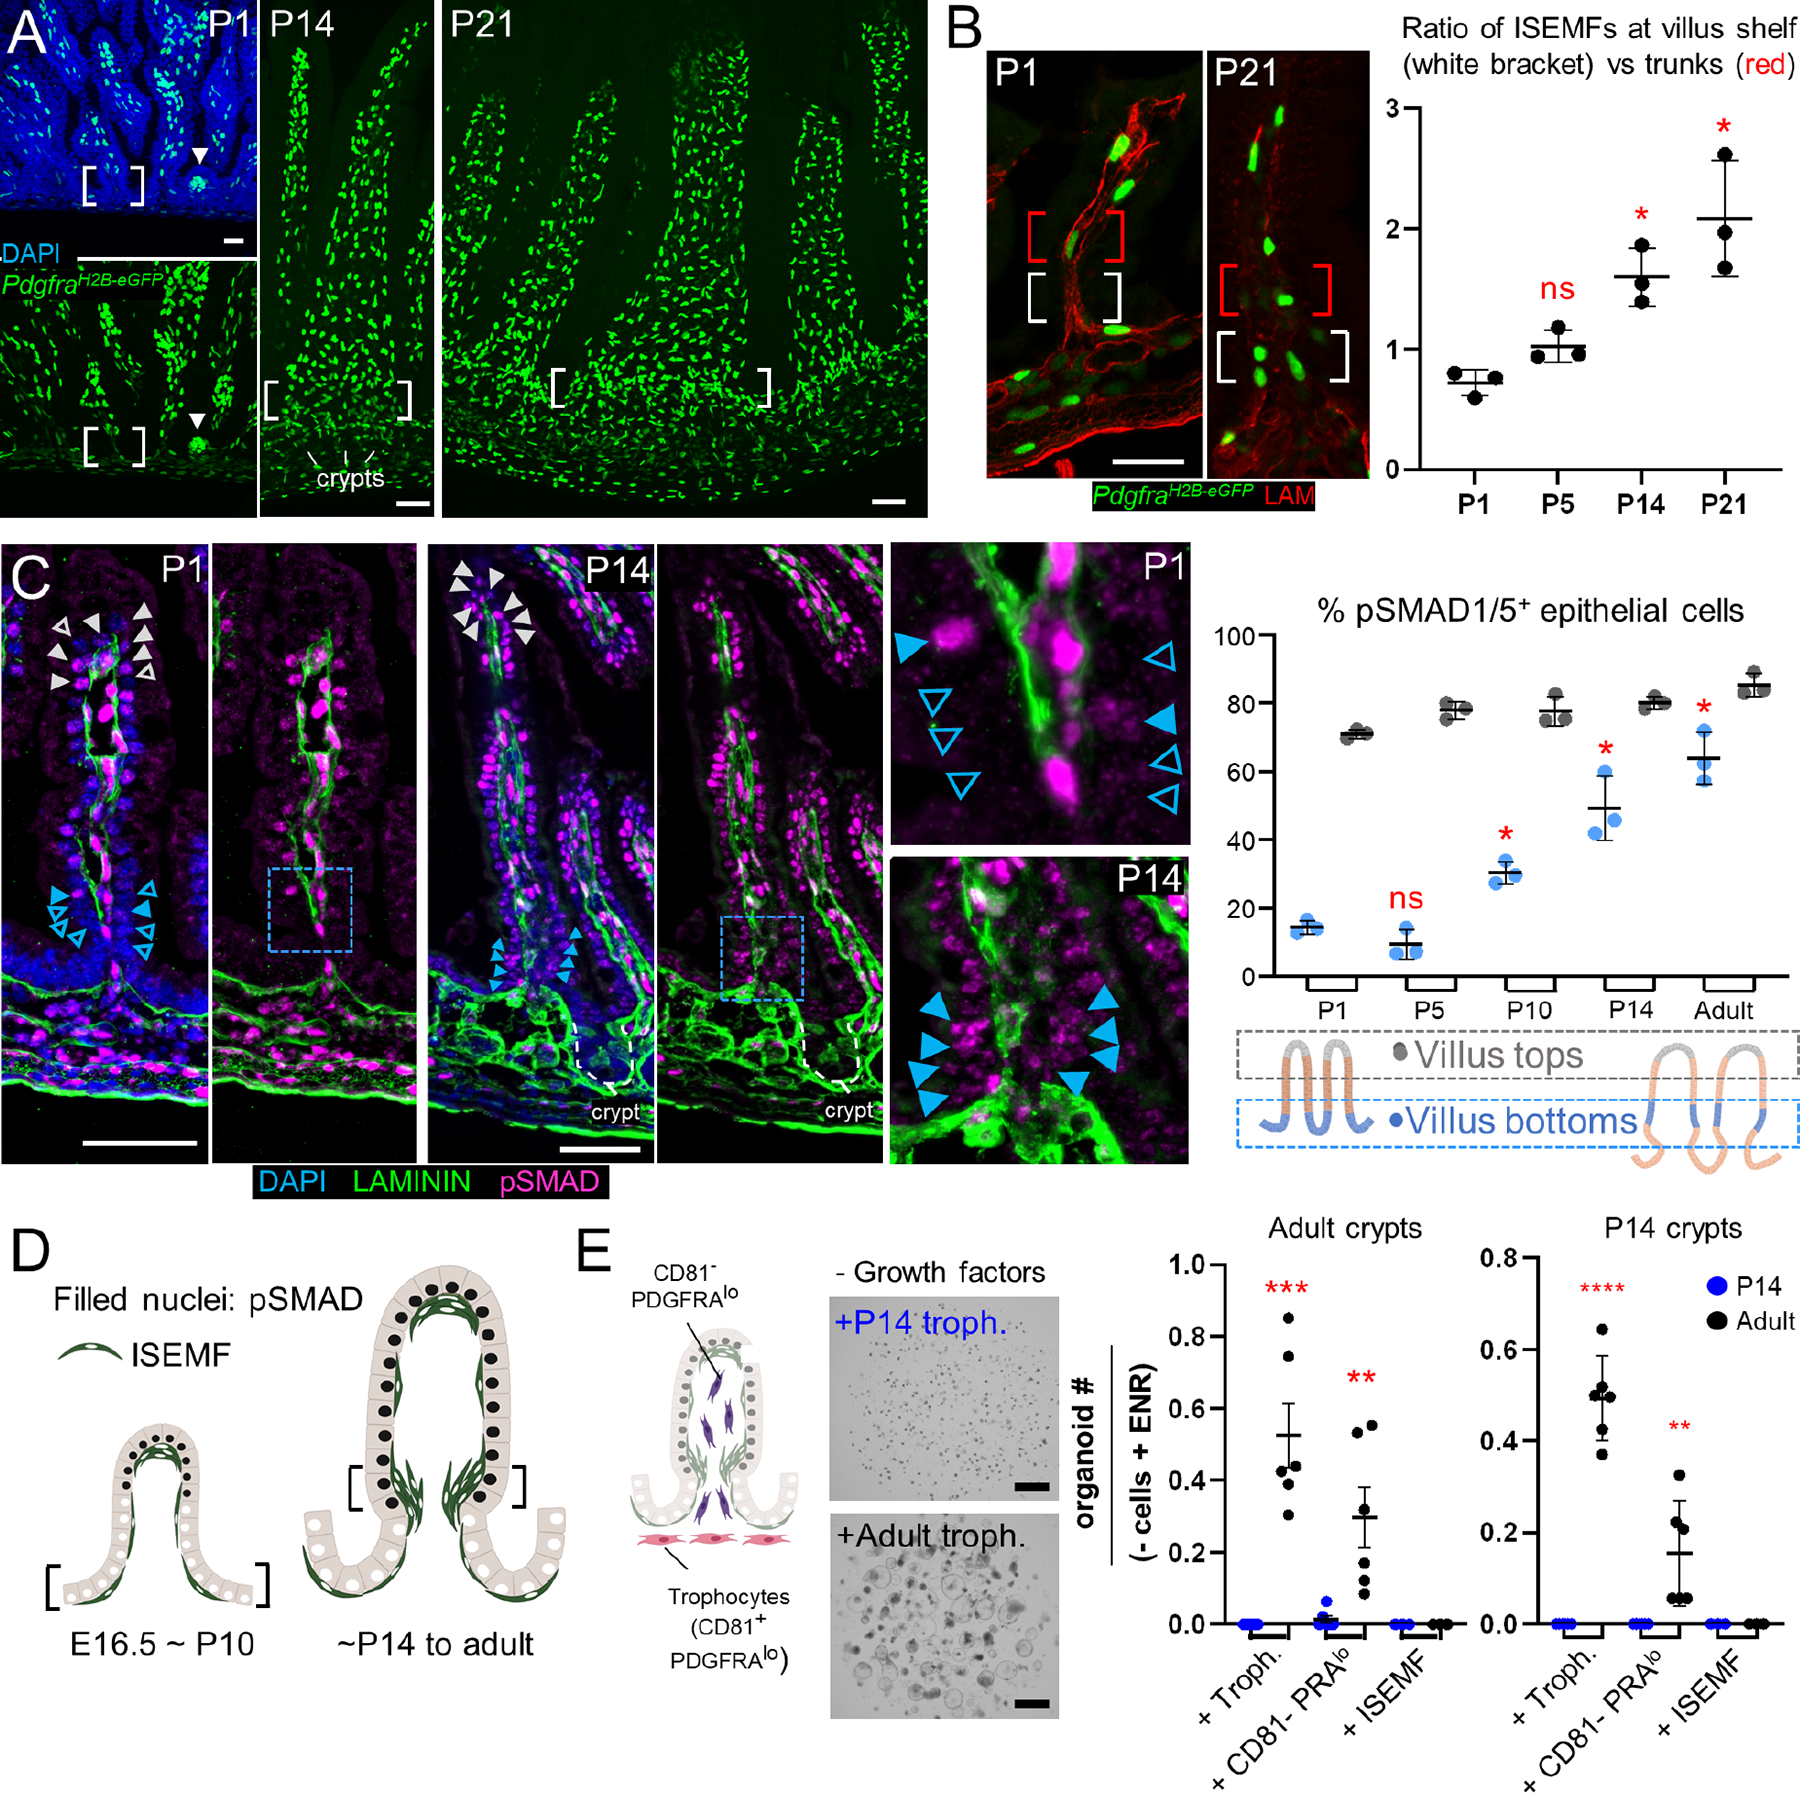
Figure 2. Postnatal epithelial BMP signaling coincides with isthmus ISEMF aggregation and young trophocytes provide limited support for organoid growth.

A-B) In PdgfraH2B-eGFP mice, GFPhi ISEMFs present on established and emerging (arrowhead) villi on postnatal day (P) 1 concentrate over the next 3 weeks at the crypt-villus isthmus shelf (white brackets). From representative images of proximal SI at the indicated ages (A, scale bars 50 μm) we quantified GFPhi ISEMF cell numbers (B) at the isthmus (white brackets, 5 lowest villus epithelial cells) in relation to villus trunks (red brackets, next 5 cells toward the villus tip); graph displays data from >25 villi/sample (n=3 animals at each age). Statistical differences are reported relative to P1 after two-way ANOVA followed by Tukey’s multiple comparisons test. ns: not significant, *P <0.0001.
C) Representative pSMAD1/5/9 (magenta) immunostaining (green: LAMININ/basement membrane, blue: DAPI) in mouse proximal SI on indicated postnatal days. cr, crypts; scale bars 50 μm; boxed regions are magnified in adjoining images; grey scale and extended images are shown in Figure S1D. pSMAD+ epithelial cell nuclei (filled arrowheads; pSMAD− cells indicated by empty arrowheads) are present at villus tops from birth, while pSMAD+ cells at villus bottoms increase over the ensuing 2 weeks. Graph displays pSMAD+ epithelial cell fractions at the bottoms (blue dots) and tops (grey dots) of >25 villi/sample (n=3 mice at each age). Statistical differences are reported relative to P1 villus bottoms after two-way ANOVA followed by Tukey’s multiple comparisons test. ns: not significant, *P <0.0001.
D) Increased epithelial pSMAD1/5 coincides with increasing isthmus ISEMF density.
E) PDGFRAlo mesenchymal cells include trophocytes (CD81+, red) and CD81− stromal cells (CD81−PRAlo, purple). Co-cultures of P14 (left graph) or adult (right graph) SI crypts with isolated adult (black) or P14 (blue) mesenchymal cells in factor-free medium. In contrast to adult trophocytes, which support robust organoid growth, P14 trophocytes are inactive. Graph depicts organoids per sample relative to control wells (- cells + EGF, NOG, and RSPO1 (ENR); 94.5 ±46.8 P14 organoids/well; 64.5 ±20.03 adult organoids/well; n=6 each). Statistical significance determined by Student’s t-test at **P <0.01, ***P <0.001 (n=3–6 biological replicates).
See also Figure S1.
