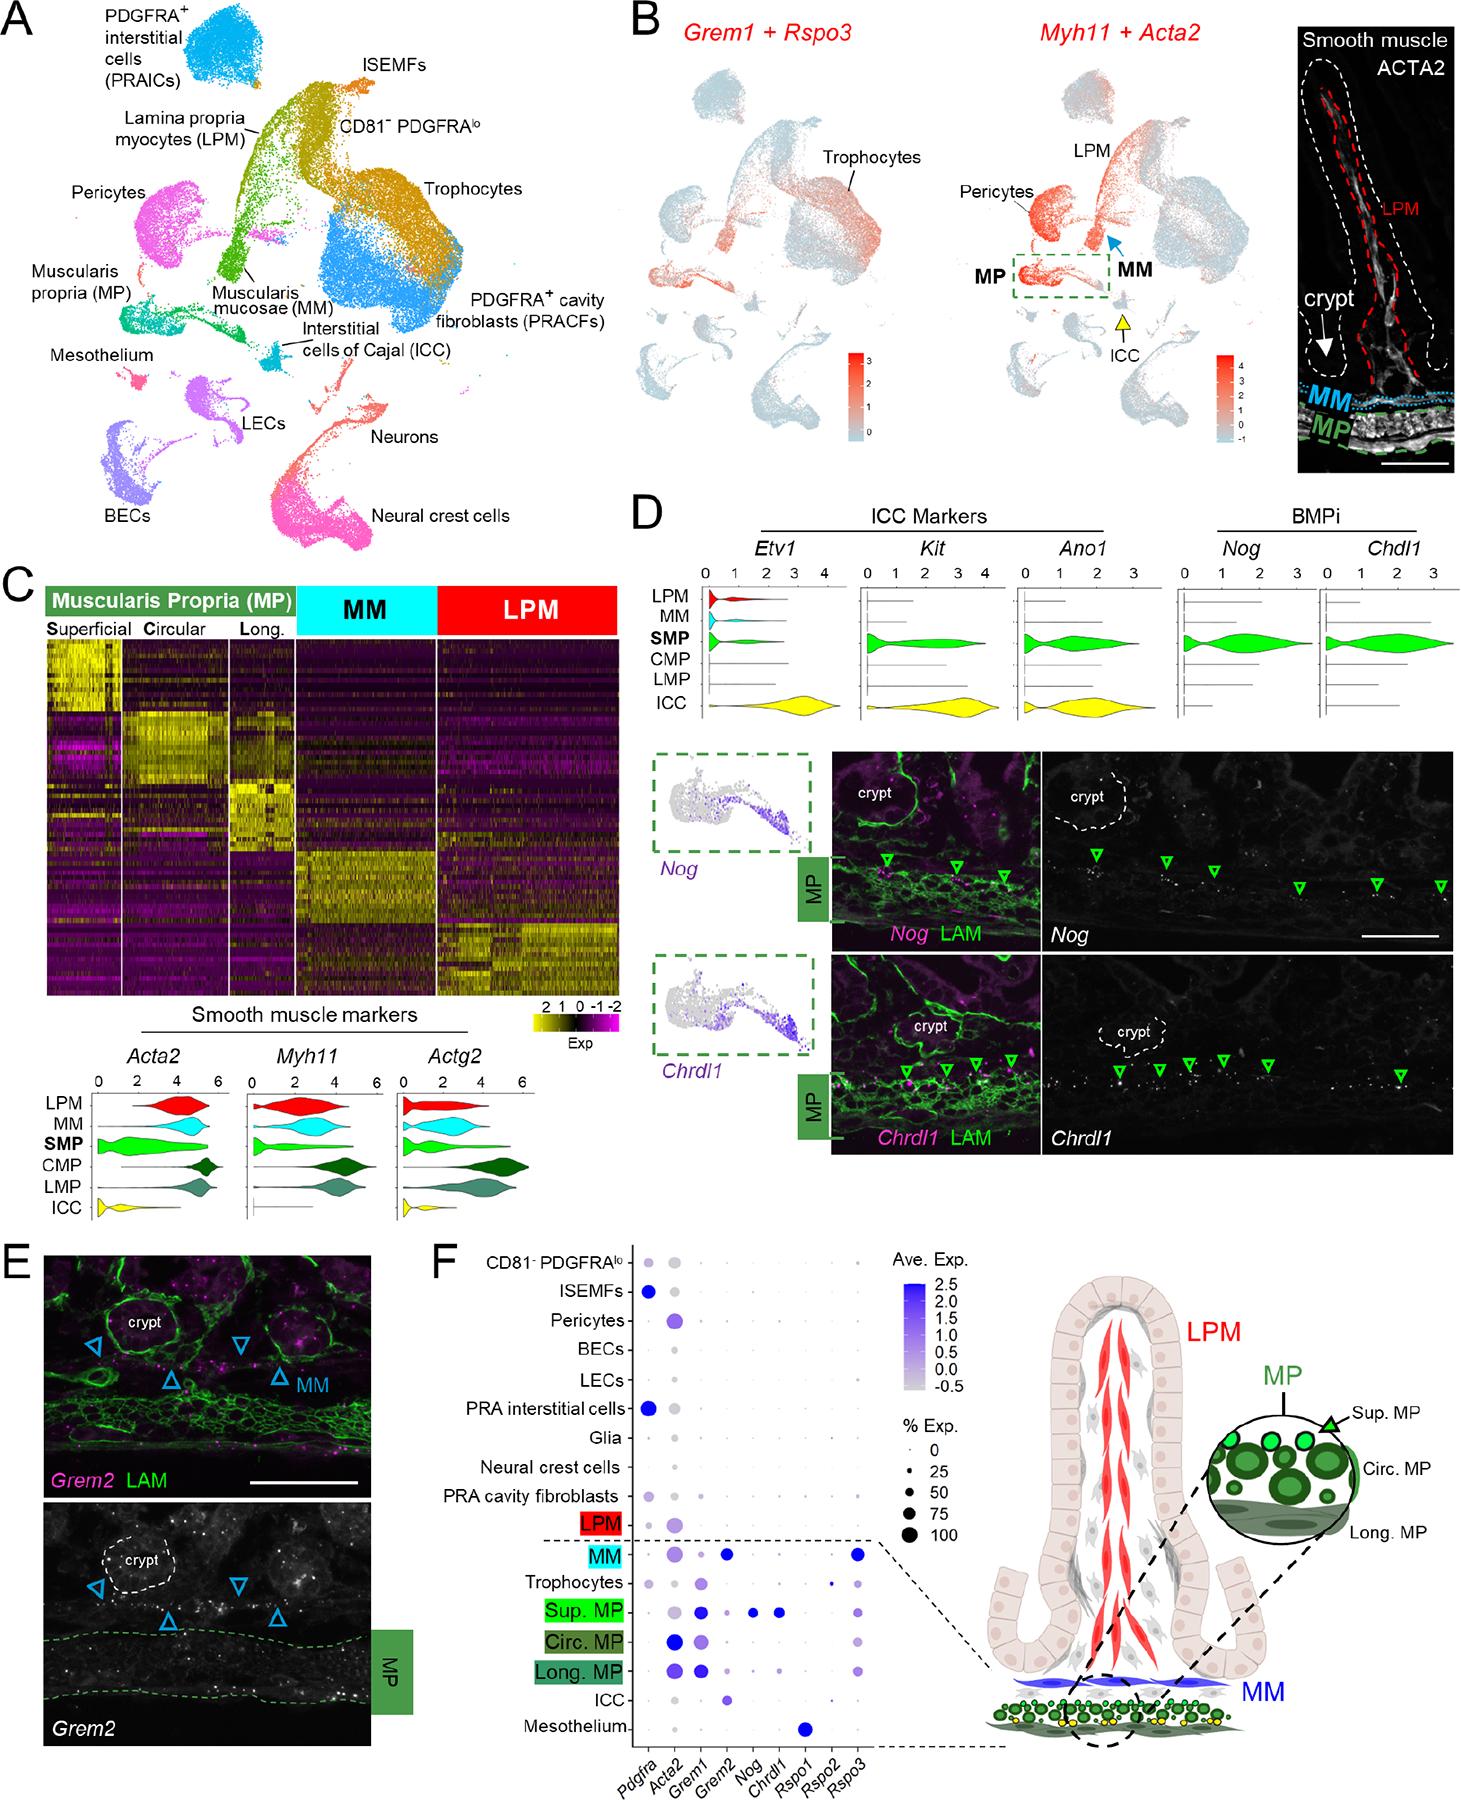
Figure 3. Diverse postnatal intestinal smooth muscle cell populations.

A) Uniform manifold approximation and projection (UMAP) of combined scRNA-seq data from whole mesenchyme and GFP+ cells from PdgfraH2B-eGFP mice, representing 51,084 non-lymphoid (Ptprc-) cells from P1/P2, P4/P5, P9, and P14. ISEMFs, intestinal subepithelial myofibroblasts; LECs, lymphatic endothelial cells; BECs, blood endothelial cells.
B) Overlay of aggregate trophic factor levels (Grem1 and Rspo3, red) on the global UMAP, showing high dual expression in distinct populations, including trophocytes. Aggregate smooth muscle marker expression (Myh11+Acta2, red) on the UMAP plot identifies distinct populations of smooth muscle corresponding to muscularis mucosae (MM), muscularis propria (MP), and pericytes. Interstitial cells of Cajal (ICC) form a distinct cluster (yellow arrow). Right: ACTA2-immunostained P14 proximal SI highlights key anatomic structures: LPM (dashed red outline), MM (dotted blue outline), MP (dashed green outline), and the epithelium (white dashed outline).
Scale bar 50 μm.
C) Top genes that discriminate each indicated smooth muscle population. MP segregates into Nog+Chrdl1+ superficial cells and the classic circumferential and longitudinal subpopulations. Gene names are listed in Table S2. Violin plots below show that superficial MP expresses markedly lower levels of genes for contractile proteins.
D) Relative expression of ICC markers and BMPi genes in each smooth muscle compartment and in ICCs. Superficial MP expresses high levels of Nog and Chrdl1, projected below onto the dashed green box within the UMAP plot from Fig. 3B. Images show RNAscope in situ hybridization (ISH) with the indicated probes (left: magenta dots, right: greyscale, green arrowheads: positive cells, green immunostain: LAMININ). Scale bar 50 μm. The findings place Nog+Chdl+ cells in the superficial MP, above the zone of circumferential fibers.
E) RNAscope ISH for Grem2 at P14 showing strong expression in MM (blue arrowheads) and lower levels in MP (dashed green outline). Top, 2-color fluorescence; bottom, Grem2 ISH in grey. Scale bar 50 μm.
F) Average expression of selected BMPi and Rspo genes across all cell types represented in the postnatal mesenchymal scRNA survey. Factors that support ISCs are largely restricted to sub-cryptal cell populations. Right: schematic representation of anatomic locations of smooth muscle populations and superficial (Sup.) Nog+Chrdl1+ MP cells.
See also Figures S2 and S3.
