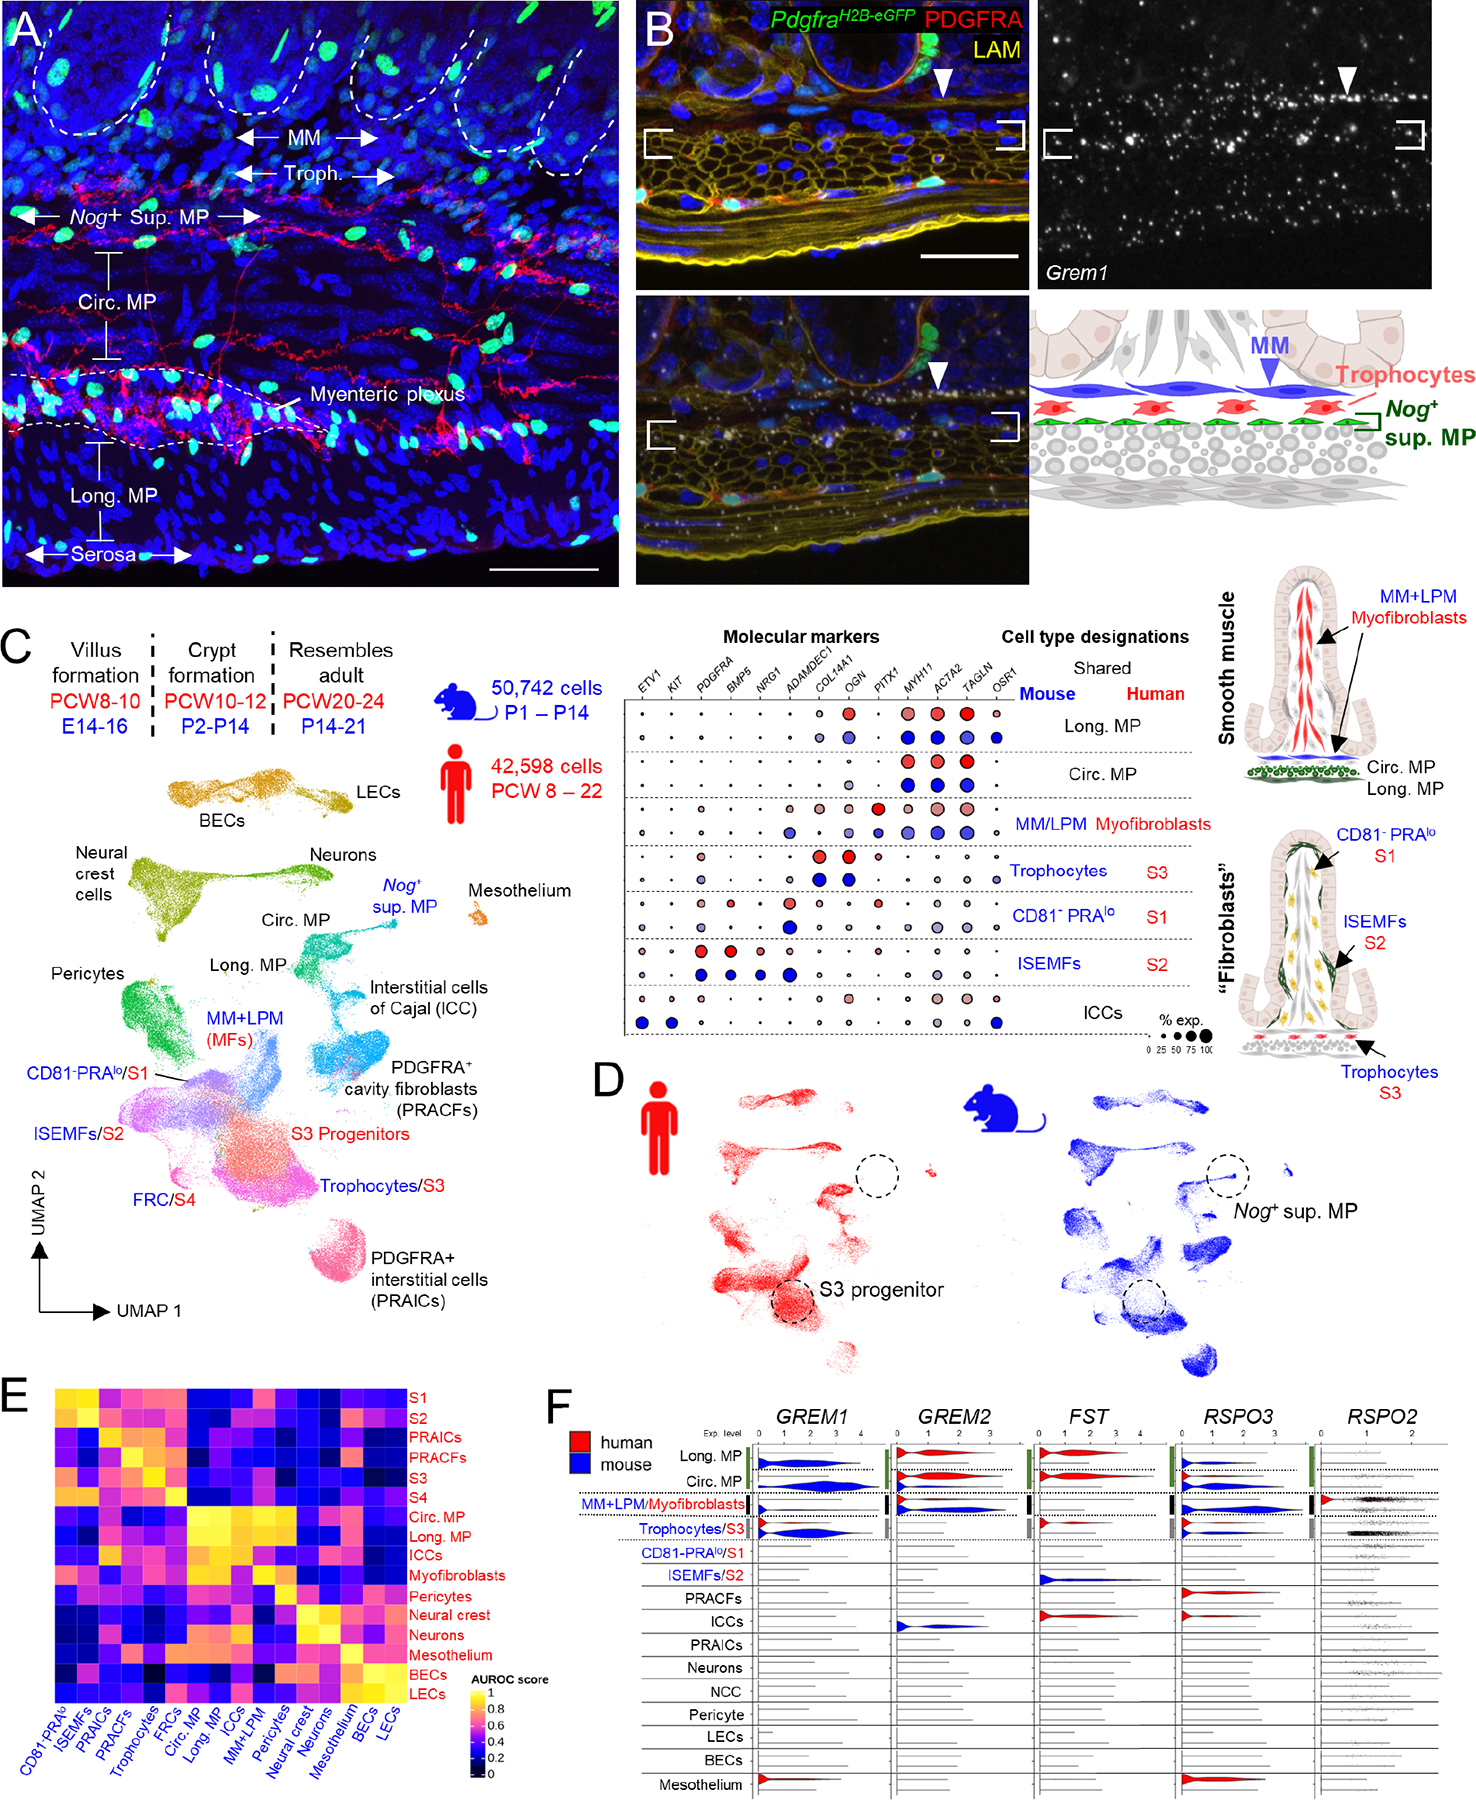
Figure 4: A sub-cryptal signaling hub in adult mouse mesenchyme and conserved mesenchymal populations in postnatal mouse and fetal human SI.

A) Representative whole-mount image from Etv1Cre(ER-T2);R26RTdTom;PdgfraH2B-eGFP adult mouse ileum, highlighting the space beneath crypts (dashed white outlines) demarcated by axonal projections (red) from Etv1+ interstitial cells of Cajal (ICCs). Pdgfralo trophocytes lie between sub-cryptal MM (unstained) and Nog+Chrdl1+ superficial MP (also unstained; neural projections separate these cells from circumferential smooth muscle). GFPhi nuclei far from peri-cryptal ISEMFs are PDGFRA+ interstitial cells72, distinct from Etv1Cre-labeled TdTom+ projections ICCs.
Scale bar 50 μm.
B) Composite Grem1 ISH overlaid on LAMININ-stained PdgfraH2B-eGFP adult mouse duodenum (sections 10 μm apart), showing high Grem1 levels in MM (arrowhead) and superficial MP (between brackets; red: PDGFRA Ab stain; green: PdgfraH2B-eGFP nuclei; blue: DAPI). The sub-cryptal signaling center encompasses muscularis mucosae (MM), trophocytes, and Nog+Chrdl1+ superficial MP.
C) Developmental timing of major intestinal morphogenetic events and UMAP from integrated analysis of postnatal mouse scRNA-seq datasets (blue, Figure 3A) with 42,598 fetal human terminal ileal cells (red) from PCW 8 to PCW 2236. Table on right (continued in Figure S4F) shows relative expression of molecular markers in cells as annotated in each species. Anatomic positions of cells are illustrated on the right. FRC, follicle reticular cell; MFs, myofibroblasts; BECs, blood endothelial cells; LECs, lymphatic endothelial cells; MP, muscularis propria; ISEMF, intestinal subepithelial myofibroblast.
D) UMAP plot from (C) separated by species, revealing heterogeneity of the human S3 pool (trophocytes and their progenitors) and a seeming lack of human Nog+Chdl1+ superficial MP.
E) Correlations between human fetal and mouse postnatal mesenchymal cell populations, depicted with reference to area under the receiver operating characteristic (AUROC) scores.
F) Relative scRNA expression of the indicated BMPi and RSPO genes across mouse postnatal and human fetal mesenchymal cell types.
See also Figures S4 and S5.
