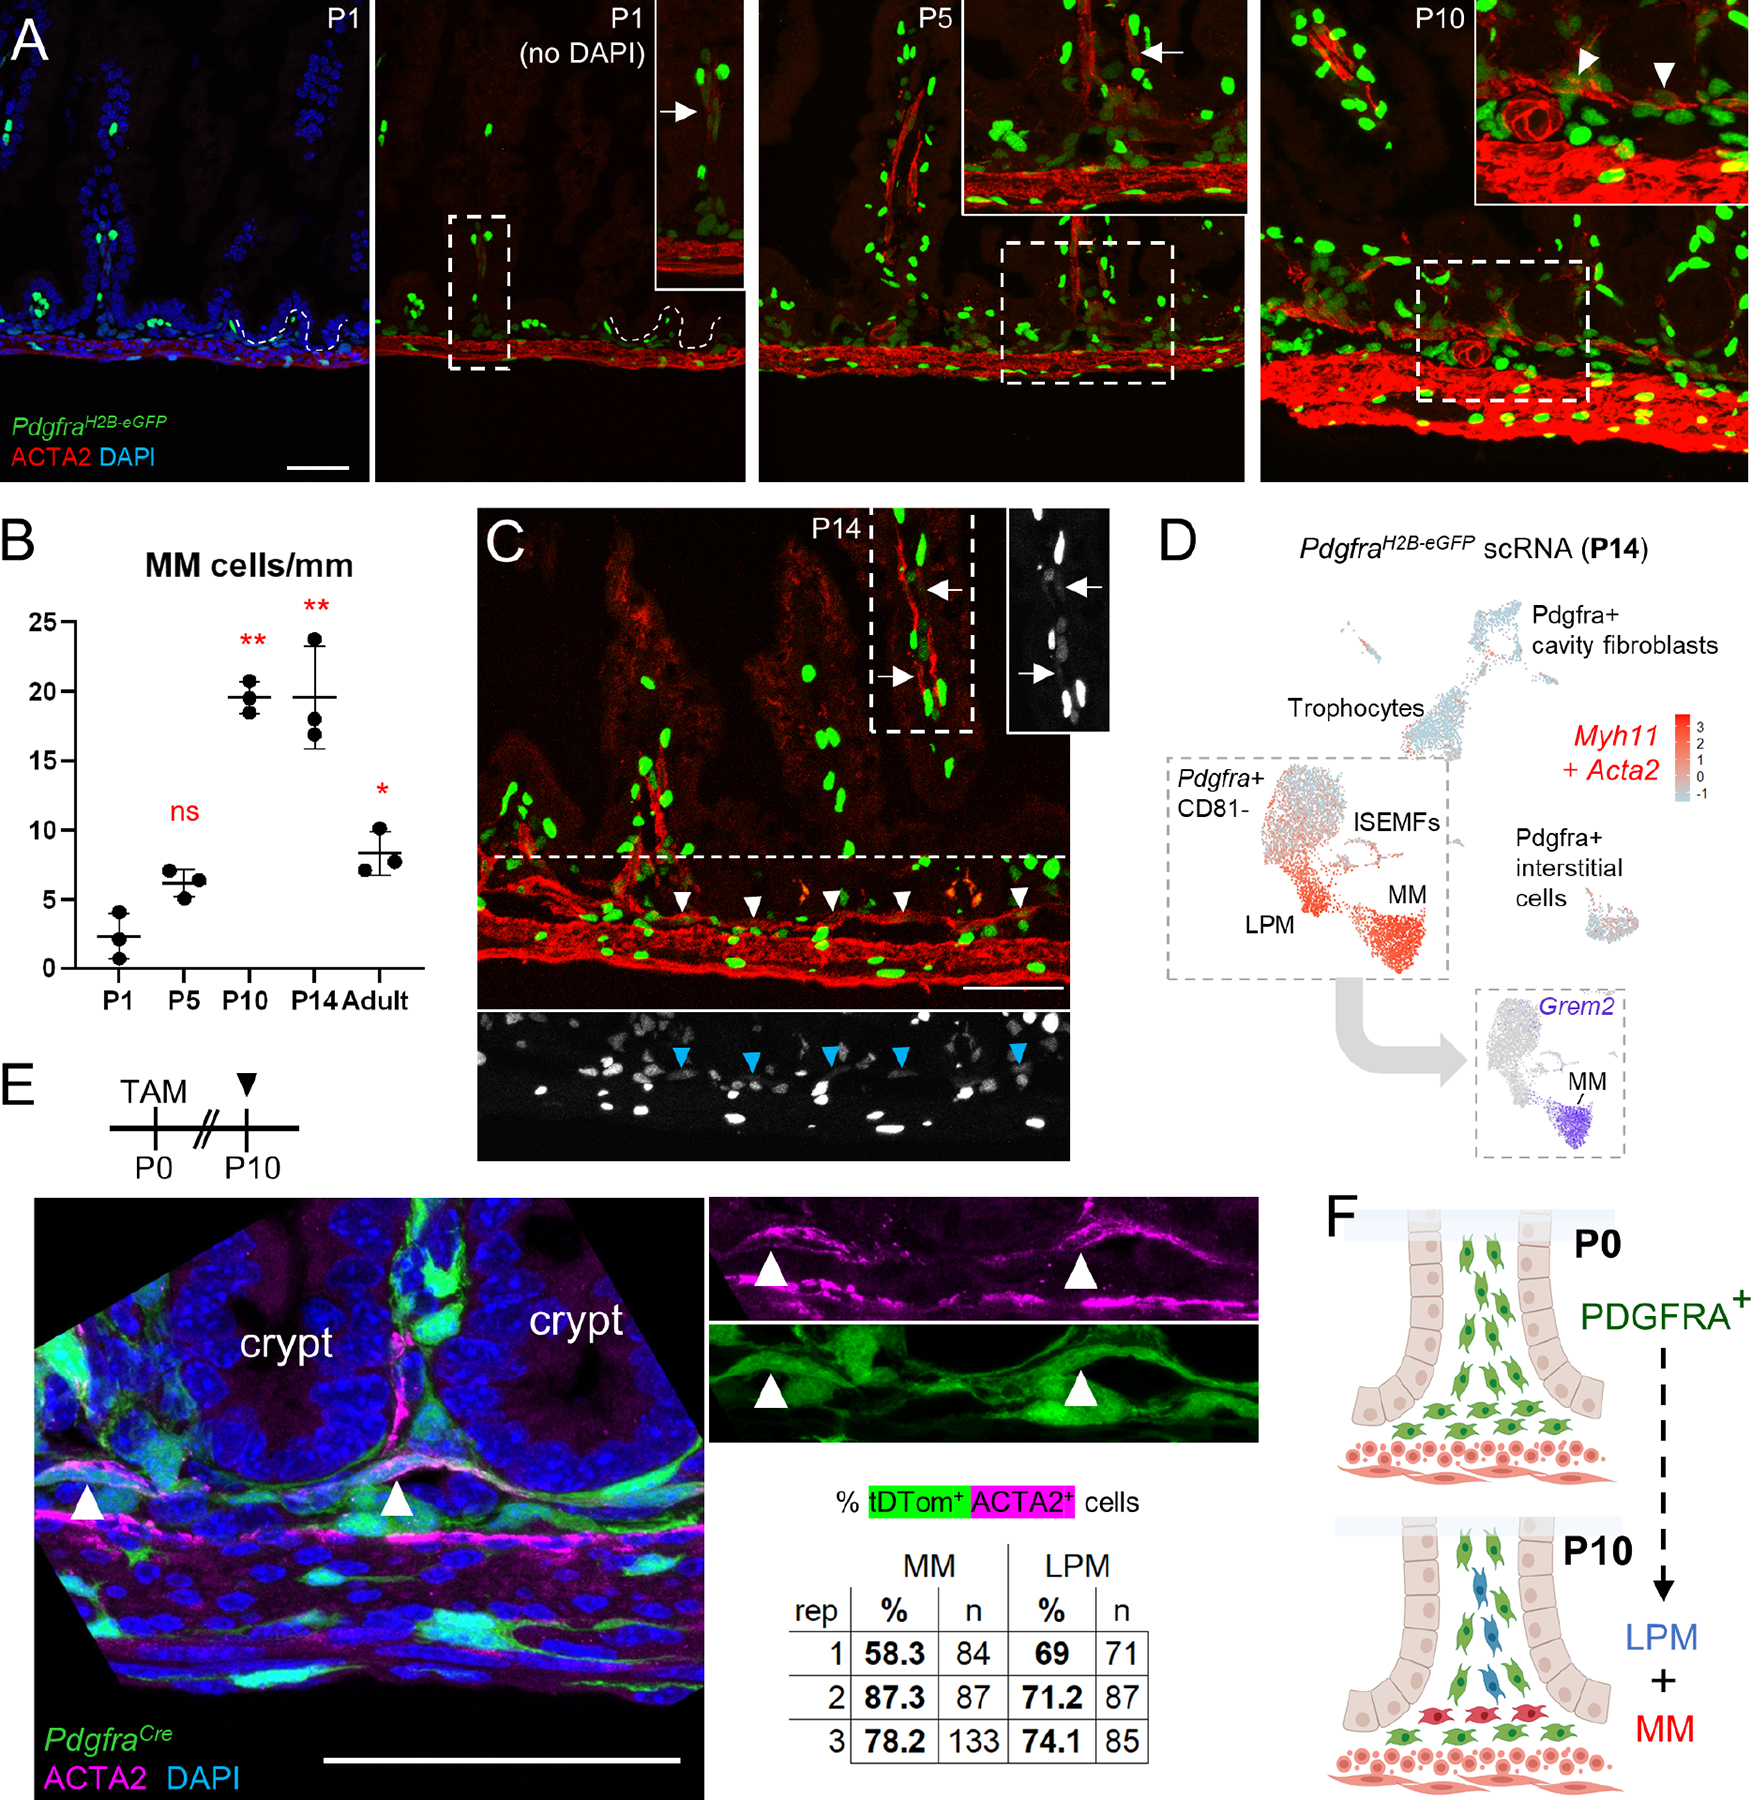
Figure 5. The MM arises postnatally from native PDGFRA+ precursor cells.

A) Representative ACTA2 immunostaining of proximal PdgfraH2B-eGFP SI at P1, P5, and P10. Boxed areas are magnified in the respective insets. While some LPM is present at P1 (arrow), MM arises between P5 and P10 (arrowheads). Scale bar 50 μm..
B) Graph depicting MM cells per mm of tissue at the indicated ages. Statistical differences with respect to P1 were determined by one-way ANOVA followed by Dunnett’s multiple comparisons test. **p <0.0001, *p <0.05, n=3 animals at each age..
C) GFP+ nuclei are evident in LPM (arrow) and MM (arrowheads) in PdgfraH2B-eGFP proximal SI at P14. Areas outlined with white dashes are shown to the right (for MP) or below (for MM) with GFP signals only in greyscale. Scale bar 50 μm..
D) Aggregate Acta2 and Myh11 expression (red) overlaid on a composite UMAP plot of GFP+ cells isolated from PdgfraH2B-eGFP mice at P14. Complementing the images in (C), the isolation shows that PDGFRA+ cells at P14 include a substantial smooth muscle fraction. Inset: Grem2 expression projected on the cells boxed in the composite UMAP plot distinguishes Grem2+ MM from Grem2- LPM..
E) PdgfraCre(ER-T2);R26RTdTom pups were treated with tamoxifen (TAM) at P0 and their intestines were examined with ACTA2 immunostaining at P10, when MM (arrowheads) showed lineage tracing (green) from Pdgfra+ precursors present at birth. Signals are merged in the left and separated in the right images. Scale bar 50 μm. tdtomato+ MM and LPM cell fractions are shown (n: number of cells counted) from >4 mm of proximal SI in each of 3 independent animals..
F) Thus, PDGFRA+ cells present at birth subsequently give rise to MM and LPM smooth muscle cells..
See also Figures S5 and S6.
